


Control the complete profile or areal measurement operator before comparing Ra, Rz, Sa or Sz on a shot-peened surface
Surface-roughness data after shot peening are comparable only when the parameter standard, profile or areal method, instrument, resolution, filtering, evaluation length or area, direction, location, form removal and process state are controlled. A bare Ra or Rz value is incomplete. It cannot establish intensity, coverage, residual stress or fatigue performance.
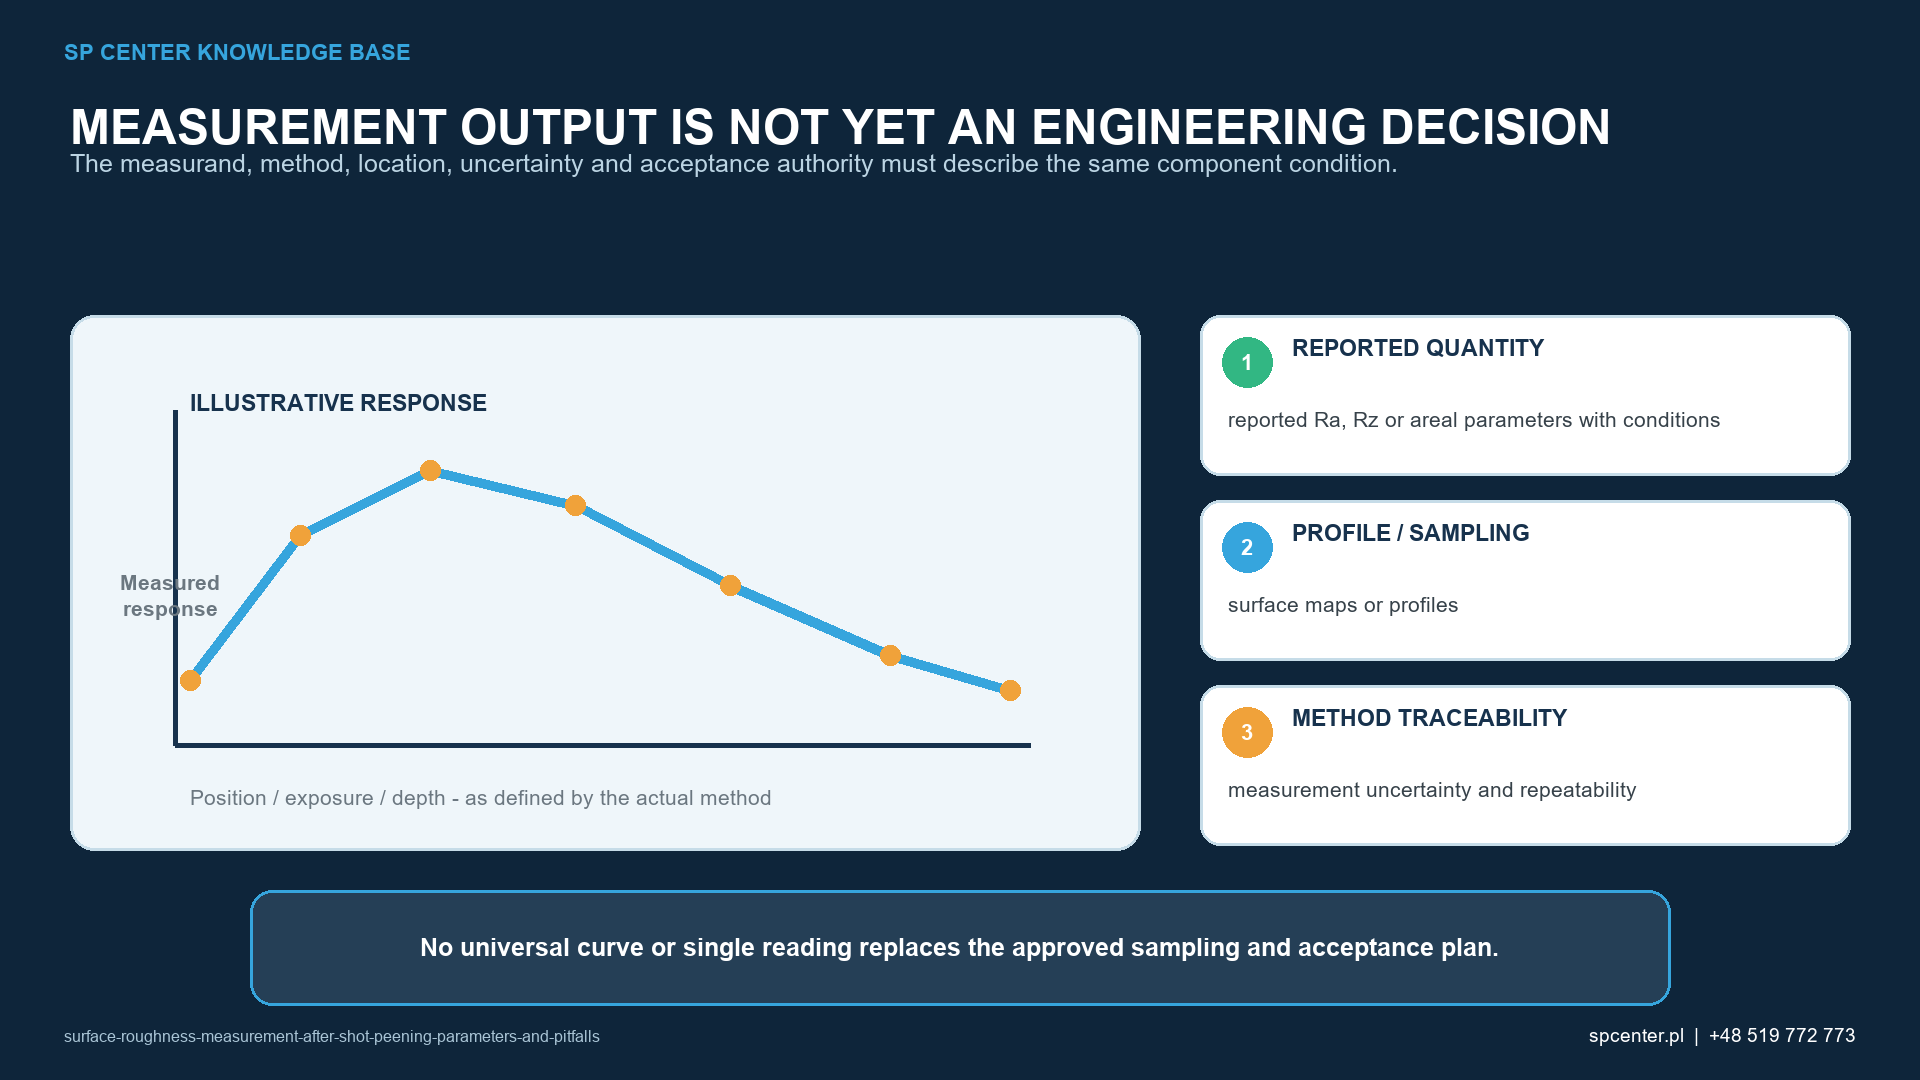
Start with the drawing and the measurement operator
First identify the functional surface, process stage and complete invoked surface-texture specification. Current ISO profile practice separates the indication, parameter definitions and specification operator across the ISO 21920 series. Areal texture uses the ISO 25178 family. Legacy drawings may invoke older documents, so the contractual revision must be read rather than silently replaced.
The complete operator defines how form and waviness are separated, which parameter is calculated, where and in what direction data are acquired and how acceptance is applied. If these fields are missing or contradictory, obtain controlled clarification before measurement.
What do Ra, Rz, Sa and Sz describe?
Ra and Rz are profile parameters; Sa and Sz are areal parameters. Ra and Sa describe arithmetic-average height characteristics in their respective data structures, while Rz and Sz describe height characteristics under their invoked definitions. The symbols do not make a profile and an area equivalent.
Shot-peened surfaces often contain overlapping craters, residual machining lay and isolated steep peaks or valleys. An average parameter may pass while a local fold or sharp impression remains unacceptable. Select parameters that answer the functional question and retain local surface-integrity inspection.
Should profile or areal measurement be used?
| Measurement route | Strength for peened surfaces | Qualification concern |
|---|---|---|
| Contact stylus profile | Direct profile trace with established profile parameters and broad industrial use | Tip radius, force, lateral resolution, skid or datum, access, curvature and trace direction can smooth or distort steep features |
| Optical profile | Non-contact trace can reach some delicate surfaces and provide dense data | Reflectivity, slope, shadowing, focus, lateral resolution and missing-point treatment affect the result |
| Optical areal topography | Shows spatial distribution, isolated features and directional texture over an area | Levelling, form removal, stitching, outlier removal, interpolation and areal filter settings must be controlled |
| Contact areal topography | Provides tactile areal data and can extract profiles from the measured field | Acquisition time, probe geometry, force, spacing and access can limit use on critical or curved parts |
| Replica followed by measurement | May provide access where the component cannot enter the instrument | Replica material, curing, shrinkage, removal, feature transfer and correlation add uncertainty |
| Microscopy for local damage | Can reveal folds, sharp impressions and isolated surface anomalies | It complements rather than automatically replaces a specified quantitative texture operator |
Table 1. Method choice depends on the specified parameter, feature, access and required spatial information.
A profile can be adequate when the drawing specifies a profile operator and the trace represents the surface. Areal topography can reveal spatial variation and isolated features, but only if its resolution, levelling, filtering and missing-data rules are suitable. More data points do not automatically mean a more accurate decision.
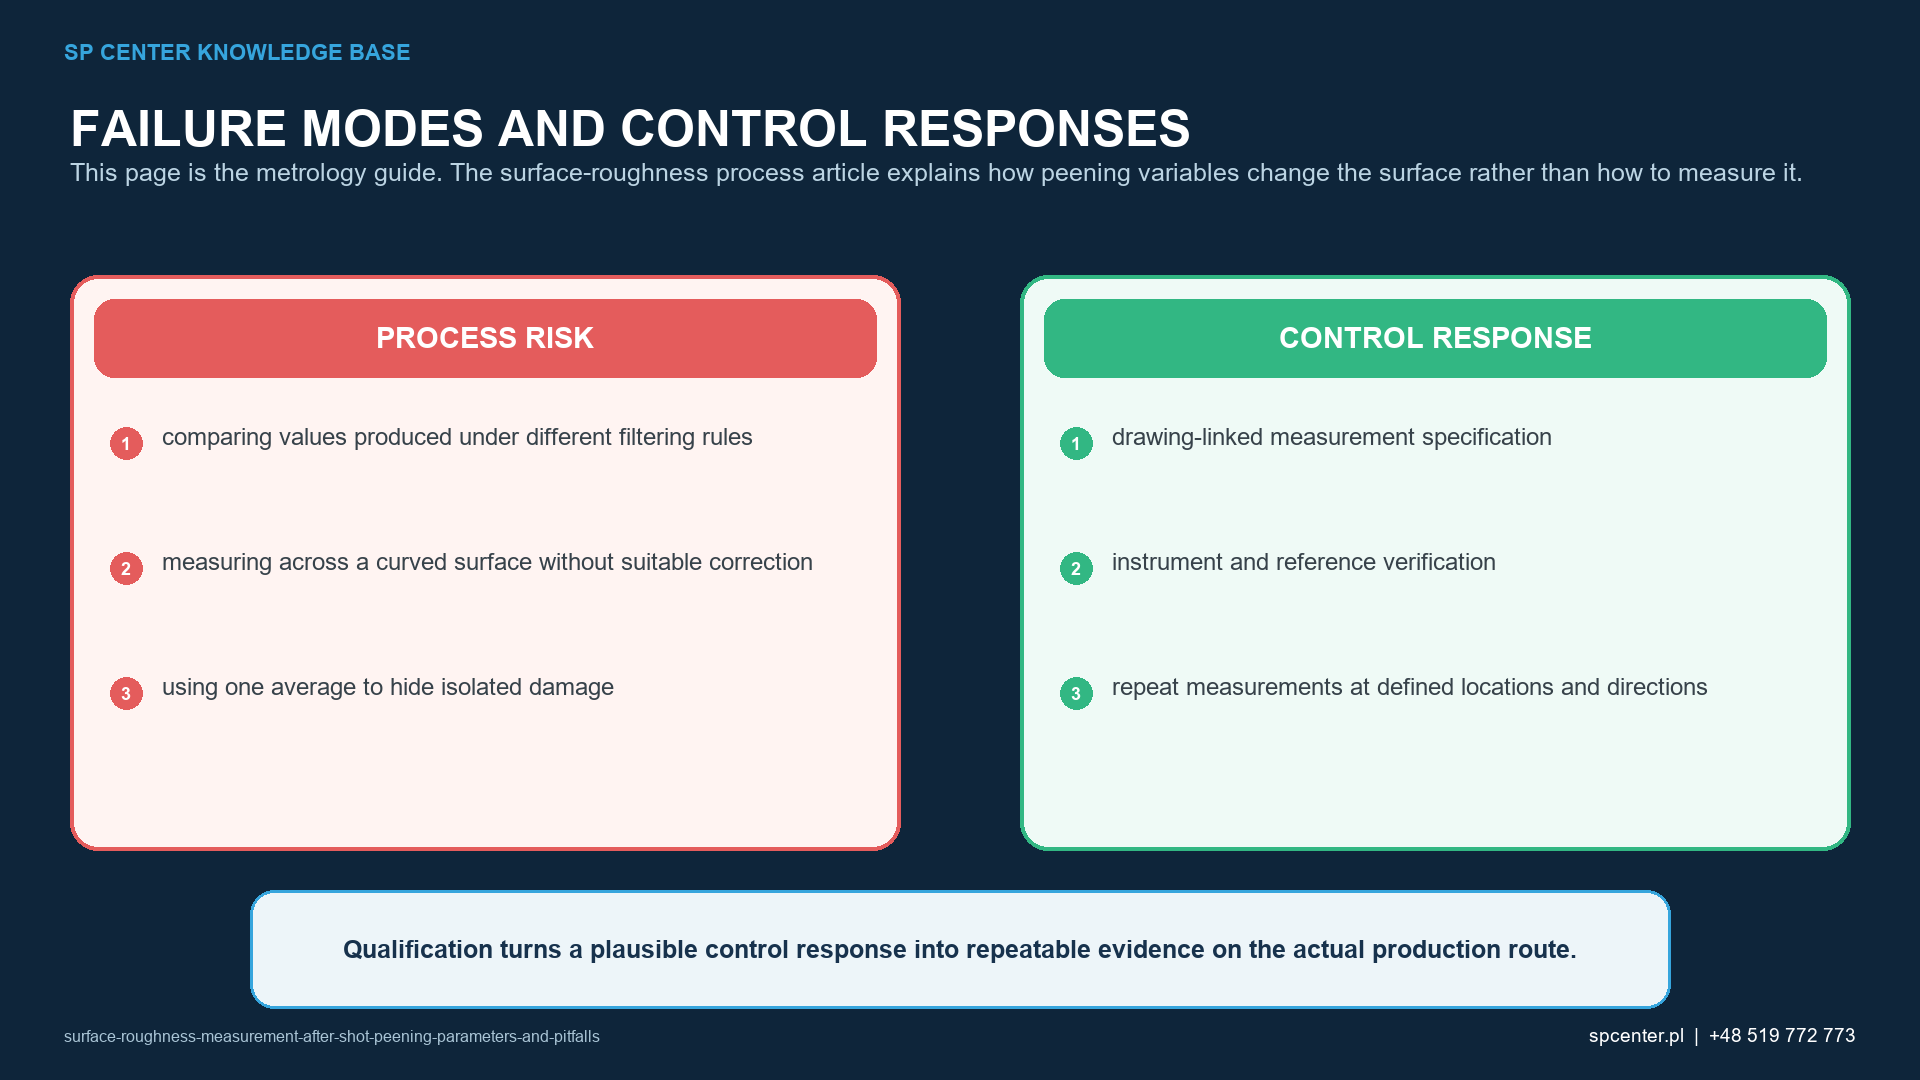
Why can stylus and optical results differ?
A stylus mechanically follows the surface with a finite tip and force. Narrow valleys can be inaccessible to the tip, and the trace can bridge steep features. Optical systems respond to focus, reflectivity, slope and sensor physics; deep or shadowed regions can generate invalid points.
For either route, lateral and vertical resolution must be adequate for the relevant texture. If two methods are used for the same acceptance decision, establish correlation across the actual material, topography and parameter range rather than relying on nominal instrument resolution.
How do filtering and evaluation length affect the result?
Profile and areal operators separate form, waviness and roughness over defined spatial scales. Changing the filter, nesting index or cutoff-related setting, evaluation length, end treatment or form-removal rule changes which surface features enter the parameter. Results produced with different operators are not automatically comparable.
Do not choose a filter after seeing the result. Freeze the operator during qualification and apply the same controlled settings in production. If an older drawing uses legacy terminology, document how it is implemented and approved under the available instrument software.
How should location, direction and curvature be controlled?
Define each trace or area from component datums. Record direction relative to machining lay, peening path, load direction and feature geometry where relevant. Curved surfaces require a justified levelling or form-removal method; an aggressive fit can remove real topography, while inadequate removal can contaminate the roughness result with component form.
Exclude edges, holes, masks or damaged regions only when the requirement authorizes it. A convenient flat area cannot represent a critical radius or worst-access location without correlation.
| Pitfall | How the result can change | Required control |
|---|---|---|
| Wrong or incomplete parameter definition | The same symbol can be interpreted under different legacy or current rules | State the full invoked standard, parameter family and specification operator |
| Different filters or evaluation lengths | Form, waviness and roughness content are separated differently | Freeze nesting indices or cutoff-related settings, evaluation length and end treatment as applicable |
| Different trace direction | Residual machining lay and anisotropic peening texture produce different profiles | Define direction relative to datums, lay, load path or feature |
| Curvature or form removed differently | Levelling can remove real texture or retain macroscopic shape | Define datum, form-removal model, fitting region and exclusion zones |
| Insufficient lateral or vertical resolution | Narrow valleys and sharp peaks are rounded, missed or clipped | Demonstrate instrument response and select a suitable tip, objective, sampling interval and range |
| Optical missing points or spike removal | Interpolation or outlier deletion can suppress genuine deep features | Retain raw data, report data-validity fraction and control all correction rules |
| One convenient measurement location | Local damage or a worst-access zone can be missed | Use drawing-linked locations and a sampling plan representing critical and variable regions |
Table 2. Common metrology changes can shift the reported value without any change to the peening process.
How are instrument fitness and uncertainty established?
Verify or calibrate the instrument with suitable material measures and procedures, then confirm range, resolution, noise, linearity and repeatability for the actual measurement task. ISO 25178-600 and ISO 25178-700 provide current frameworks for areal instrument characteristics and verification. ISO 25178-601:2025 covers contact stylus instrument design and replaces withdrawn ISO 3274:1996.
Measurement uncertainty includes more than instrument calibration. Location, surface variability, repeat setup, direction, filtering, operator, tip or objective, environment and data correction can all contribute. State the decision rule when uncertainty is relevant to conformance.

What should be reported for a release measurement?
| Report field | Minimum content | Why it matters |
|---|---|---|
| Requirement | Drawing and revision, surface, process state, standard and parameter with acceptance rule | Identifies the contractual question |
| Location and direction | Datum-based coordinates, feature, trace or area orientation and excluded regions | Makes repeated measurements comparable |
| Instrument | Manufacturer, model, sensor or probe, tip or objective, range and software version | Defines the physical acquisition chain |
| Operator and settings | Filter or nesting indices, evaluation length or area, sampling spacing, levelling, form removal and correction rules | Defines how raw data becomes the reported parameter |
| Metrological status | Verification or calibration status, reference measure, date and environmental conditions where relevant | Supports traceability and instrument fitness |
| Results | Individual values, summary rule, units, repeatability and measurement uncertainty when required | Prevents a mean from hiding local or measurement variation |
| Data and disposition | Raw profiles or topographies when required, anomalies, invalid data, deviation and release authority | Preserves the audit trail and enables reassessment |
Table 3. The report must allow another competent laboratory to understand how the value was produced.
Report individual measurements as well as any authorized summary statistic. A mean without the maximum, minimum, location or invalid-data record can hide a local failure. Keep raw profiles or topographies when the governing quality plan or investigation requires later review.
How is the measurement system transferred or changed?
A change of instrument, probe, stylus tip, optical objective, software, filter implementation, fixture, location program or data-cleaning rule can change results. Compare old and new routes on representative peened surfaces and document bias, repeatability and limits before production use.
Do not correct a measurement discrepancy by changing the peening process until metrology, incoming surface and local sampling have been separated. Product disposition follows the responsible quality and engineering authority.
Frequently asked questions
What is the difference between Ra and Rz after shot peening?
Ra and Rz are different profile parameters defined by the invoked standard and operator. Ra represents an arithmetic average characteristic, while Rz represents a height characteristic. Neither alone describes isolated damage or a complete areal texture.
Can Rz values from different drawings or standards be compared?
Not from the symbol alone. Historical and current standards can define or evaluate Rz differently. Compare only after confirming the complete standard, filter, evaluation length, direction and instrument conditions.
Should a stylus trace run across the machining lay?
The required direction must be specified for the engineering question. Peening can reduce but not necessarily erase prior lay, so measurements in different directions may not be equivalent.
Is an areal Sa value equivalent to profile Ra?
No automatic equivalence exists. They are evaluated from different data structures and operators. A correlation must be established for the actual surface and functional decision.
Can an optical instrument replace a contact stylus?
Only after method suitability and correlation are demonstrated. Steep slopes, reflectivity, resolution and missing-data handling can make optical and contact results differ.
How many roughness measurements are required?
The governing drawing, specification or qualified sampling plan decides. The plan should cover process variation and critical locations rather than using one convenient trace as universal evidence.
Does calibration alone prove that the measurement is valid?
No. Calibration or verification addresses instrument status. Method selection, resolution, settings, location, direction, surface cleanliness, uncertainty and operator execution must also be suitable.
Can roughness data prove correct shot-peening intensity or coverage?
No. Roughness is a component surface response. Intensity and coverage require their own approved evidence, and an acceptable roughness result cannot replace either.
Key takeaways
- A Ra or Rz number without its operator and location is incomplete.
- Do not equate profile Ra with areal Sa or assume optical and stylus equivalence.
- Freeze filtering, evaluation, direction, form removal and invalid-data rules.
- Measure critical and variable regions, not only a convenient flat location.
- Verify instrument fitness and include repeatability and uncertainty where required.
- Keep roughness, intensity, coverage and surface-damage acceptance as separate evidence.
Related SP Center guides
- Predicting and Controlling Surface Roughness
- Hardness and Microhardness After Shot Peening
- Residual-Stress Depth Profiles
- Fatigue Testing After Shot Peening
Technical sources
1. ISO 21920-1:2021, Surface texture: Profile — Indication of surface texture
3. ISO 21920-3:2021, Surface texture: Profile — Specification operators
5. ISO 25178-600:2019, Metrological characteristics for areal topography measuring methods
7. ISO 25178-601:2025, Design and characteristics of contact stylus instruments
Standards note: Apply the complete revision invoked by the drawing and contract. Published ISO 21920 documents are under revision; committee drafts are not automatic replacements for the invoked published editions.
Author: Paweł Kmieć
Discuss surface-texture measurement after shot peening: +48 519 772 773 | [email protected]