


Design matched groups, stress levels, replicates, runouts, S-N analysis, failure-origin review and traceable process evidence
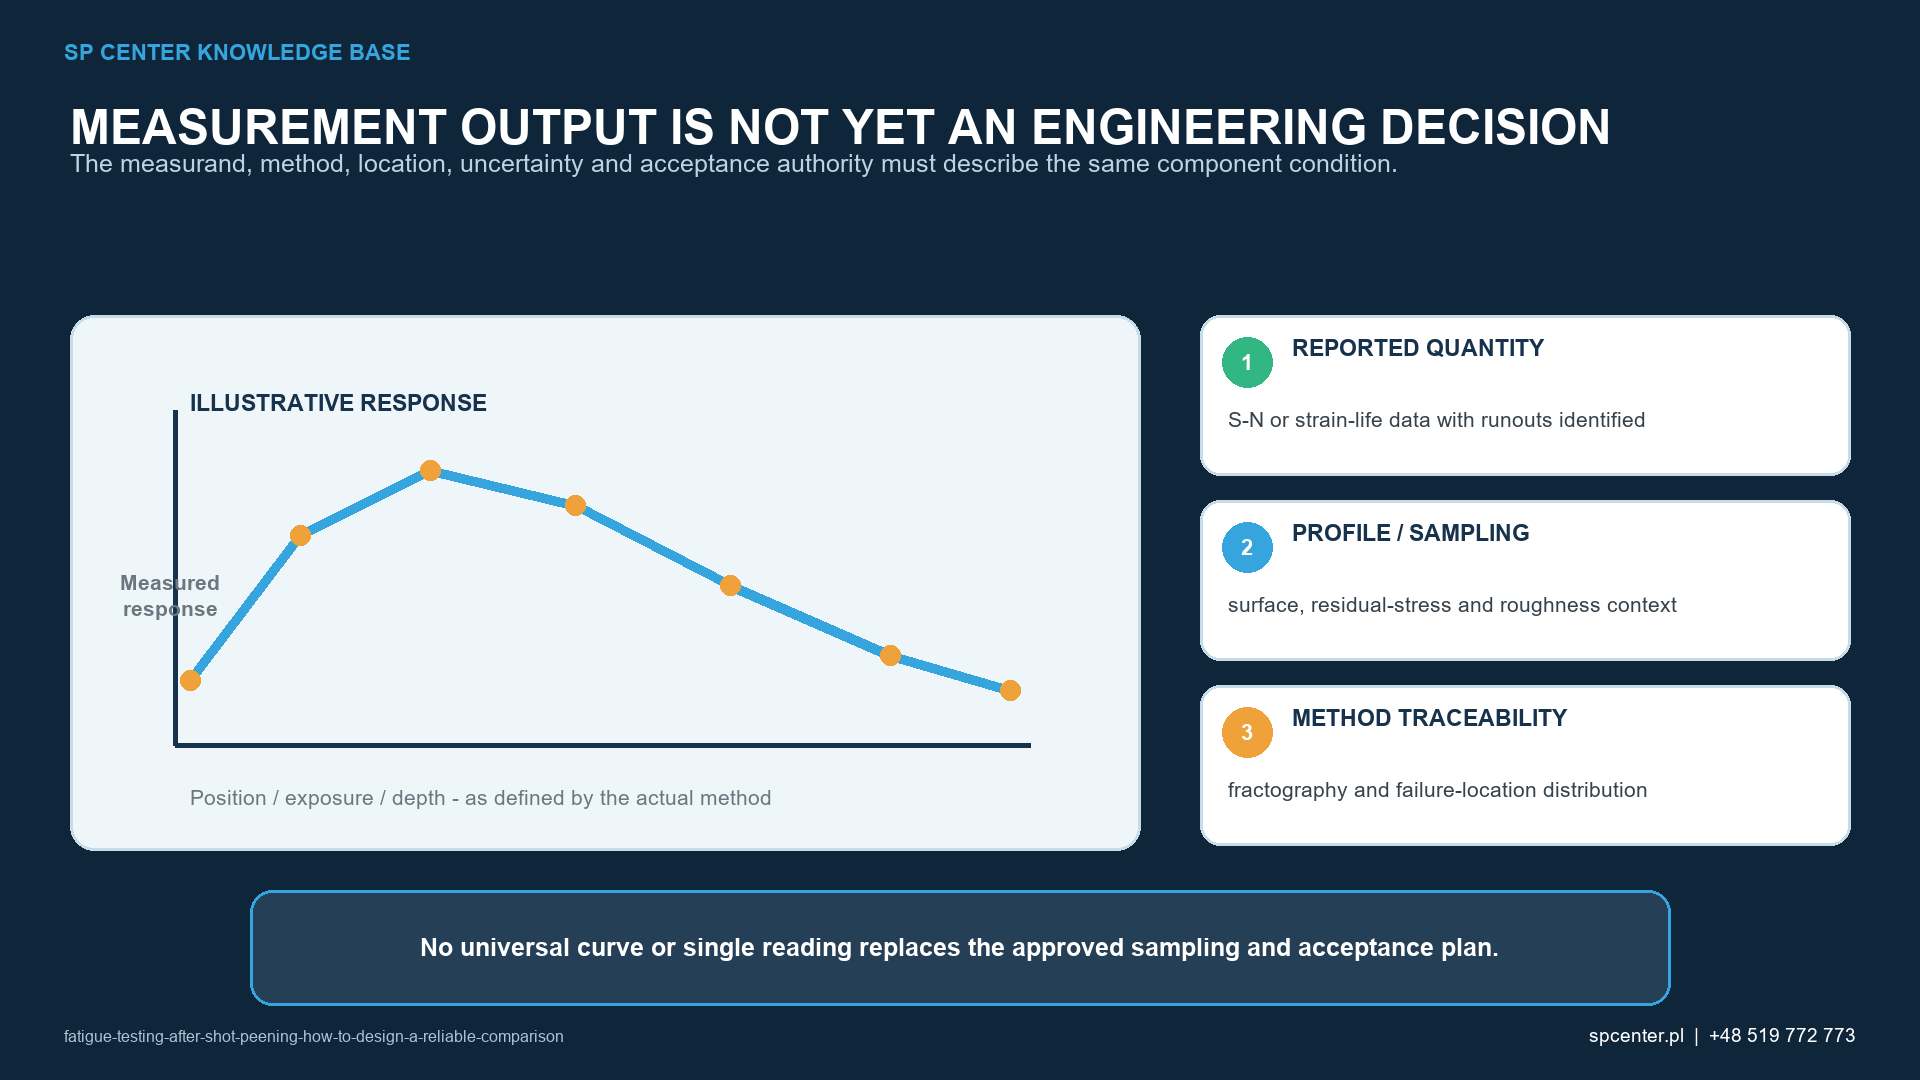
A reliable fatigue comparison after shot peening begins with a precise claim. Screening a process, qualifying a change, verifying a component and generating design data require different specimen numbers, stress levels and evidence. The untreated and peened populations must be matched for material, geometry, machining, surface sequence and test conditions, while the shot peening route is fully traceable. Cycles to failure alone are not enough: runouts, statistical uncertainty, failure origin and the represented process window determine what the result actually proves.
What question should the fatigue programme answer?
| Study purpose | Minimum comparison | Claim boundary |
|---|---|---|
| Process screening | Matched untreated and candidate-process groups over useful stress levels | Ranks the tested conditions; does not create a design allowable |
| Process qualification | Approved baseline against the proposed equipment, media, intensity, coverage and sequence | Applies only to the represented material, geometry and process envelope |
| Design verification | Representative feature, load mode, stress concentration, surface and environment | Supports the defined component duty, not every service spectrum |
| Change assessment | Current approved route and one controlled change with sufficient repeats | Separates the evaluated change only if other variables remain balanced |
| Failure investigation | Conforming reference, suspect population and documented incoming conditions | Identifies evidence and causes; it does not authorize disposition by itself |
Table 1. The purpose determines the test matrix, statistical confidence and allowed engineering claim.
Write the hypothesis before selecting a specimen. For example: under one defined axial loading condition, does a qualified peening route change the S-N response of a specified alloy and surface condition relative to an otherwise identical untreated baseline? This is more defensible than asking whether shot peening improves fatigue in general.
How should untreated and peened groups be matched?
Use the same material population, product orientation, heat treatment, machining route, specimen geometry and inspection. Allocate specimens to groups by a randomized or blocked plan so that heat, bar position, machine batch or test order is not confounded with treatment.
Preserve identity from raw material through fracture. If specimens come from several heats or lots, distribute those sources across groups and include them in the analysis. Rejecting an outlying result after seeing the outcome requires a predeclared technical rule and documented reason.
Which variables can invalidate the comparison?
| Variable | What must be fixed or balanced | Bias if uncontrolled |
|---|---|---|
| Material | Heat or batch, product form, orientation, composition, heat treatment, hardness and microstructure | Material scatter is attributed to peening |
| Specimen or component | Geometry, notch, machining, edge condition, dimensions, location and stock removal | Different stress concentration dominates the result |
| Surface route | Grinding or polishing, cleaning, coating, corrosion exposure and handling before and after peening | A sequence change is mistaken for a peening effect |
| Peening | Machine, media, Almen intensity, coverage, fixture, masks, motion, exposure and batch evidence | The treated group contains several unknown process conditions |
| Test loading | Force or strain control, waveform, stress range, mean stress or R ratio, frequency and alignment | Nominally equal tests experience different cyclic demand |
| Environment and stop rule | Temperature, medium, humidity where relevant, failure criterion and runout cycle limit | Censored specimens and environmental effects are misclassified |
Table 2. Fatigue is sensitive to variables that can easily overshadow the peening effect.
How should the shot peening condition be documented?
Record equipment, air-blast or wheel route, programme, fixture, masks, media identity and condition, complete Almen range and strip designation, saturation-curve or verification evidence as required, coverage, exposure, movement, part loading, alarms and deviations. State the manufacturing sequence and time between treatment and testing where relevant.
A conforming Almen value does not prove component coverage, residual-stress depth or fatigue life. Those are separate evidence layers. Witness coupons should be demonstrably representative of the surface, geometry and batch claim they support.
How are stress levels, replicates and runouts selected?
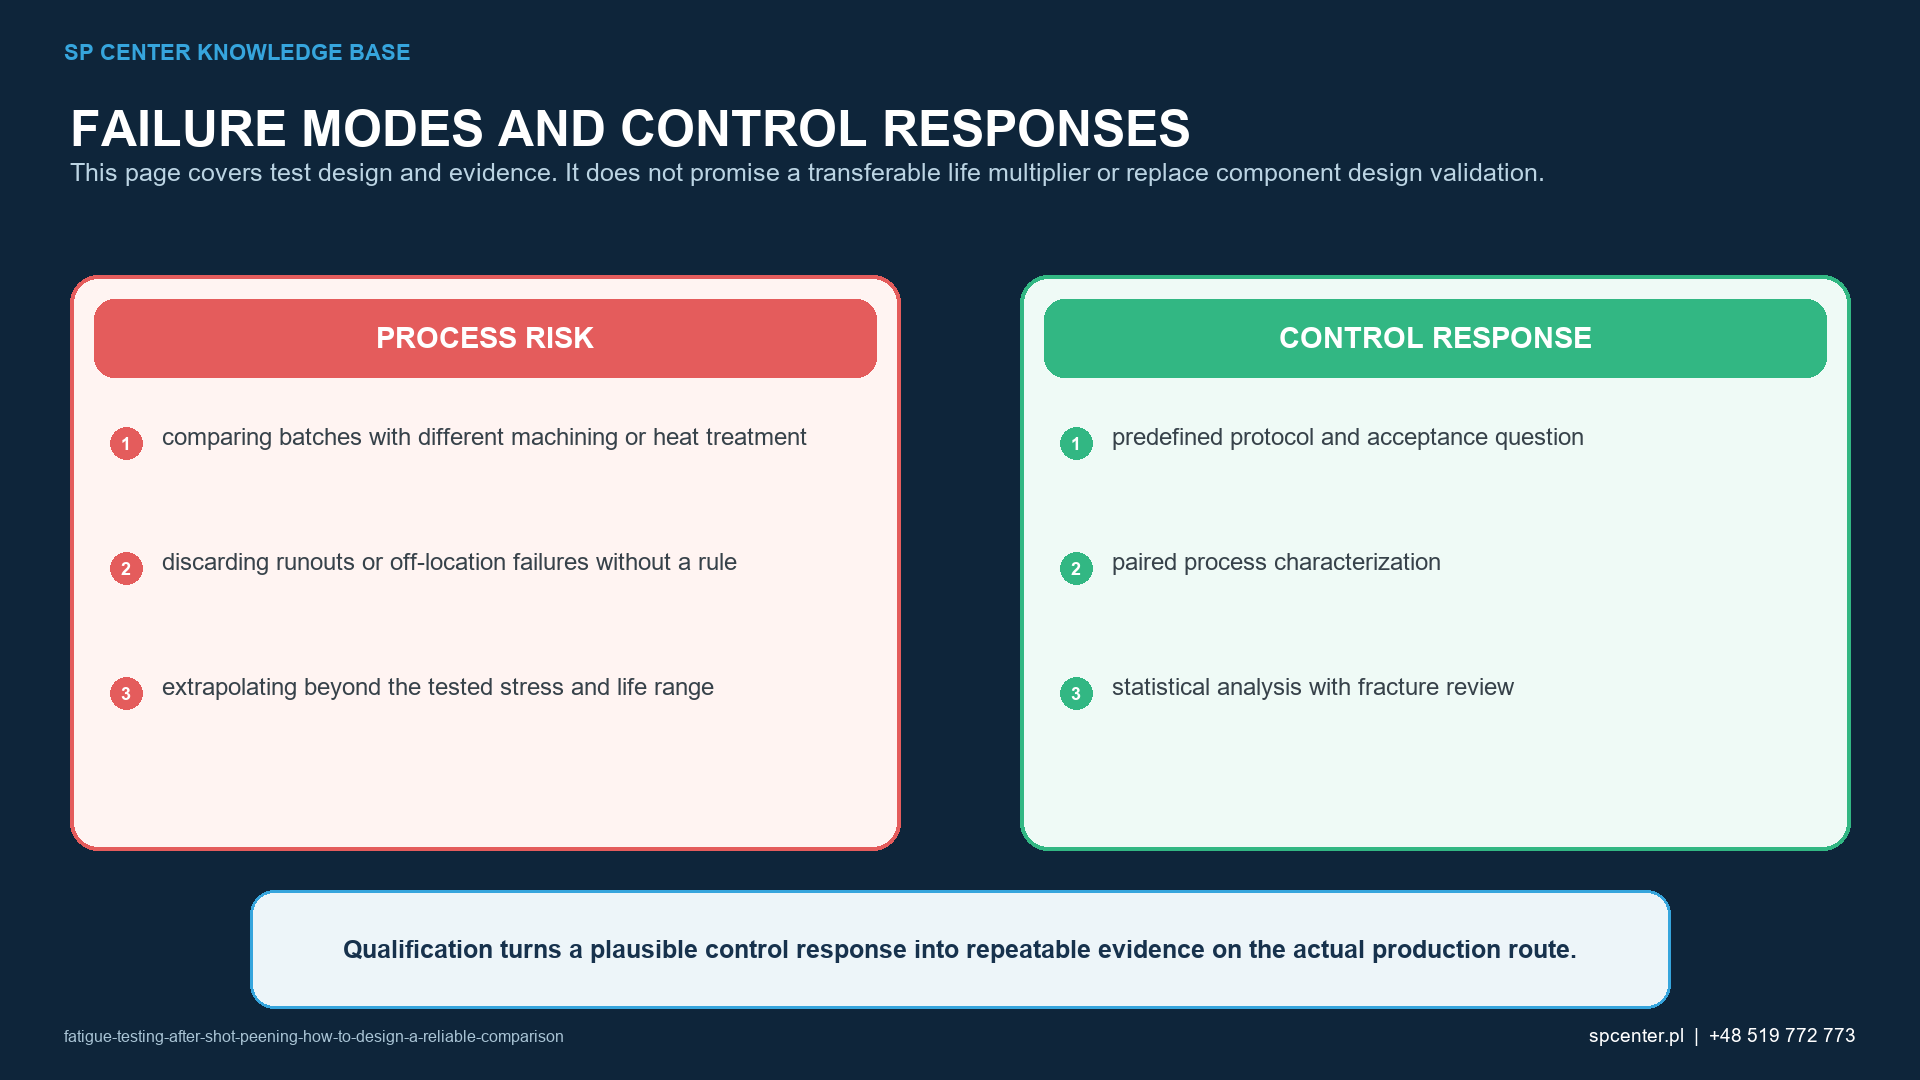
Select stress levels that resolve the region relevant to the engineering decision rather than clustering all failures at one extreme. Replicates are needed to estimate scatter. The number follows the statistical power, expected variance, number of groups and desired confidence, not a universal rule of three or five.
Define the failure criterion and runout cycle limit before testing. A specimen that reaches the limit without failure is a right-censored observation. Treating it as infinite life or as an ordinary failure at the limit biases the comparison. Predefine whether and how a runout will be retested or used for another examination.
Which loading and environment details matter?
State force- or strain-control mode, waveform, frequency, stress amplitude or range, maximum and minimum load, R ratio, alignment, temperature, atmosphere or corrosive medium and any dwell. Surface residual stress can relax differently under high cyclic stress, elevated temperature or another environment.
Axial, rotating-bending, torsional, fretting, variable-amplitude and full-component tests do not answer the same question. ASTM E466-21 concerns force-controlled constant-amplitude axial tests of metallic specimens in a defined scope. ISO 1099:2017 covers an axial force-controlled method, while a revision is under development; use the version contractually selected for the programme.
How should fatigue results be analysed?
| Analysis output | Required treatment | Unsafe shortcut |
|---|---|---|
| Cycles to failure | Report each result, stress level, runout status and valid exclusions | Comparing only group averages |
| S-N relationship | Use the predeclared statistical method, uncertainty and applicable stress range | Drawing a curve through too few or selectively removed results |
| Runouts | Retain as censored observations under the selected method and state the limit | Counting every runout as a failure at the limit or as infinite life |
| Failure origin | Fractography and location classification by defined rules | Assuming every break started at the peened surface |
| Surface integrity | Relate roughness, damage, hardness or residual-stress data to the exact group and location | Using one witness coupon for every specimen |
| Transfer to component | State material, geometry, loading, environment and process limits | Claiming a universal percentage life increase |
Table 3. Transparent treatment of every result is more important than a visually impressive mean curve.
Report the chosen stress-life model, transformations, confidence or prediction intervals, treatment of runouts, validity rules and sensitivity to excluded specimens. ASTM E739 and ISO 12107 address statistical planning or analysis for fatigue data; the full invoked documents and qualified statistician define the method.
Why is fractography necessary?
A longer or shorter life can result from a different crack origin rather than a uniform shift in surface behaviour. Inspect and classify the fracture origin, initiation feature and propagation region. Note whether failures begin on the peened surface, at a mask boundary, in a subsurface inclusion, at a machining defect, in the grip or outside the valid gauge section.
Invalid grip failures, machine trips or specimen defects require documented disposition under predeclared rules. Fractography also helps determine whether the specimen geometry represents the component failure mechanism.
What supporting measurements strengthen the conclusion?
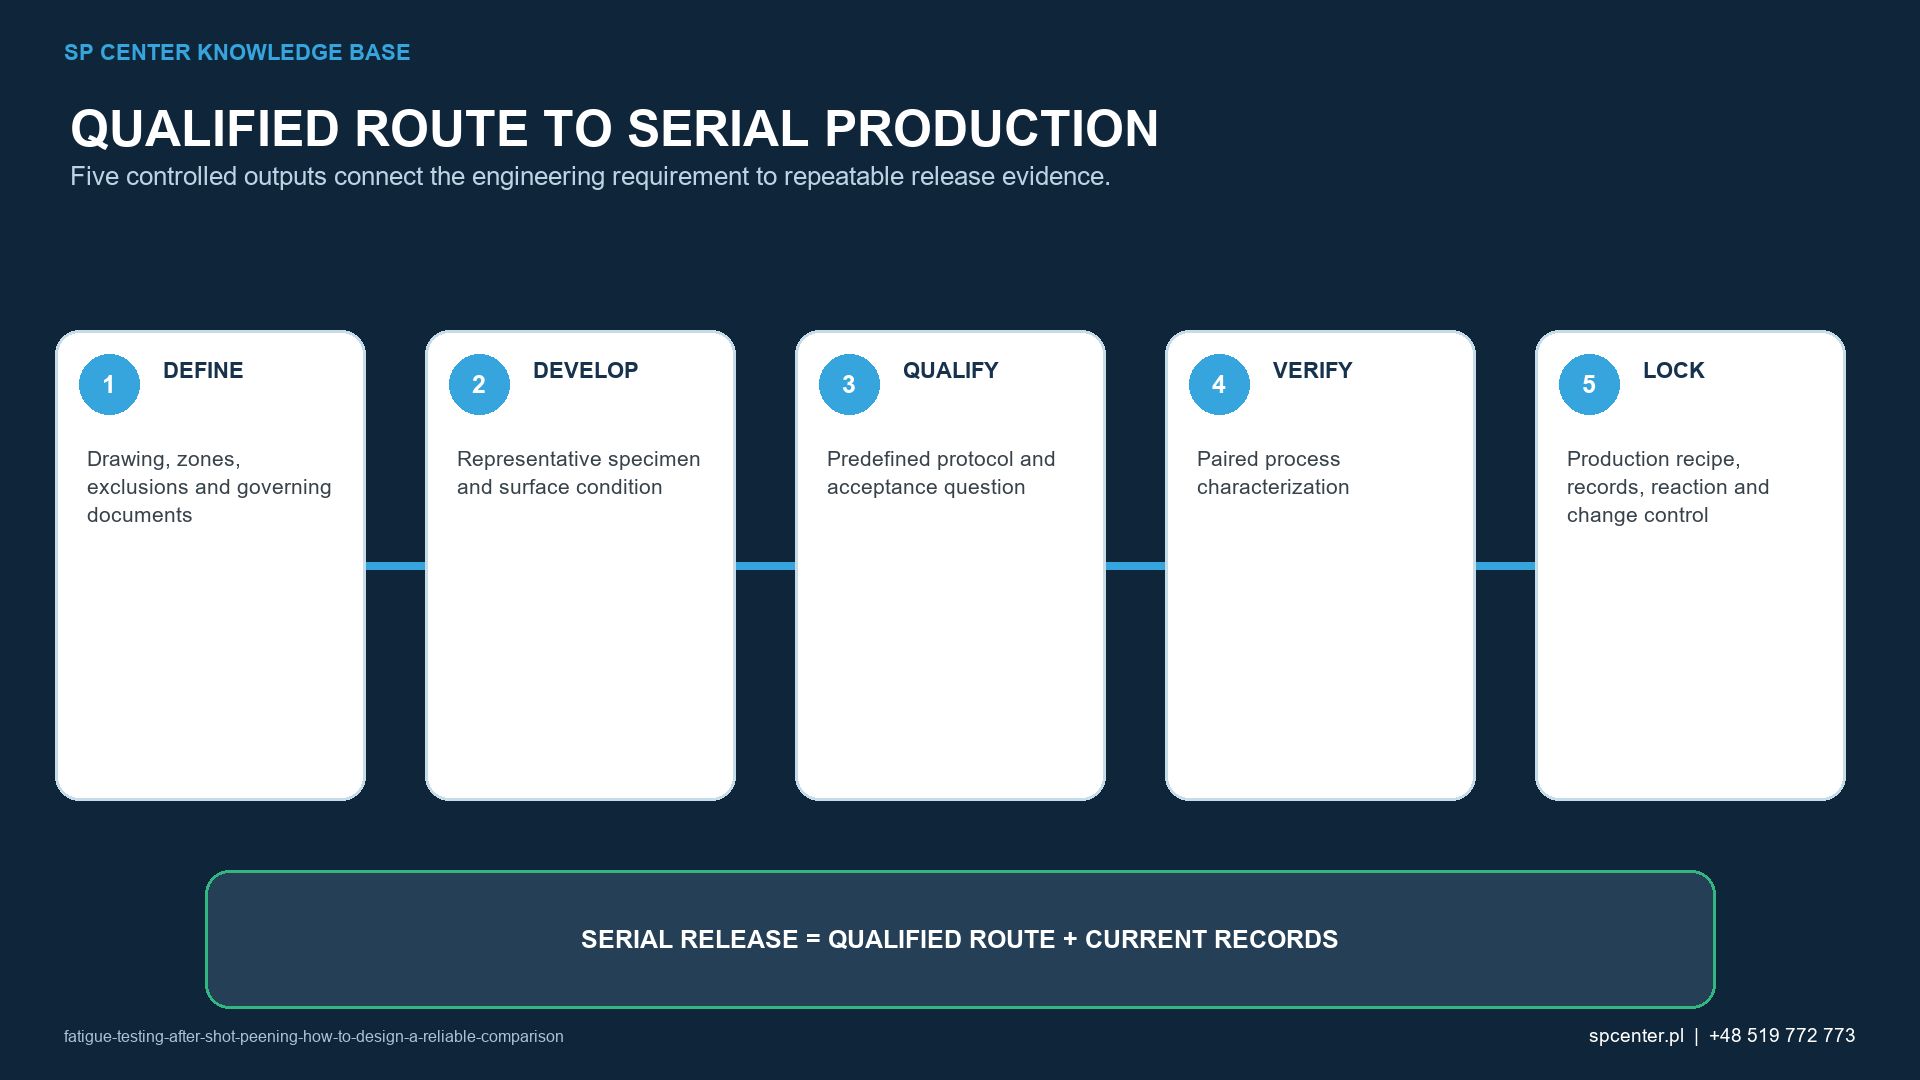
Roughness, surface damage, hardness or microhardness, XRD residual-stress depth profiles, cold-work indicators and dimensions can explain mechanisms. They do not replace fatigue testing and should be sampled from the exact groups and locations in the plan. Measurement uncertainty and destructive material-removal effects must be stated.
Measurements before and after cyclic loading can reveal relaxation, but the act of sectioning or layer removal changes the specimen. Use dedicated witnesses or a technically justified sequence.
What belongs in the final test report?
- Purpose, hypothesis, approval authority and claim boundary.
- Material heat or lot, product form, orientation, heat treatment, hardness and microstructure.
- Specimen drawing, machining, surface sequence, dimensions and allocation method.
- Complete shot peening configuration and batch traceability.
- Test standard and revision, equipment, calibration, alignment, load history and environment.
- Individual results, runouts, exclusions, deviations and statistical method.
- Fracture origins and representative images under defined classification.
- Supporting surface or residual-stress evidence and explicit transfer limits.
Frequently asked questions
How many fatigue specimens are needed?
There is no universal number. It depends on the claim, expected scatter, stress levels, statistical method, runout rule and required confidence. A statistician or qualified test authority should set the sample plan before testing.
Can one stress level prove a fatigue improvement?
A single level can support a limited comparison when properly replicated, but it does not establish the full S-N relationship or behaviour at other mean stresses, environments or geometries.
Should untreated and peened specimens come from the same heat?
Where feasible, matching and randomized allocation within the same controlled material population reduce confounding. If several heats are needed, balance or model them explicitly.
Does higher Almen intensity guarantee longer fatigue life?
No. Intensity is a peening-stream metric. Surface roughness, damage, residual-stress profile, material and loading interact, and an excessive route can reduce performance.
What is a runout?
It is a valid specimen that reaches the predefined cycle limit without meeting the failure criterion. It is censored information, not proof of infinite life and not automatically a failure at that limit.
Should residual stress be measured on every specimen?
Only if the test plan requires it. Destructive depth profiling can consume specimens and redistribute stress. Use a representative, traceable sampling plan and keep residual stress separate from fatigue outcome.
Can rotating-bending data be compared directly with axial data?
Not without a validated conversion or design basis. Stress gradients, volumes at risk, alignment and failure modes differ. Use the test method that represents the engineering question.
What records must accompany the fatigue report?
Include material and specimen traceability, complete peening records, test machine and method, loading and environment, individual results and runouts, exclusions, statistics, fracture origins, deviations and the exact claim boundary.
Key takeaways
- Define the claim before choosing specimens or stress levels.
- Match and randomize material, geometry, machining and test order.
- Trace the exact peening route for every treated specimen.
- Plan replicates and runout treatment statistically before testing.
- Combine cycles to failure with fracture-origin and surface evidence.
- Never generalize a percentage life improvement beyond the represented basis.
Related SP Center guides
Technical references
1. ASTM E466-21, Force-Controlled Constant-Amplitude Axial Fatigue Tests
2. ASTM E468/E468M-23a, Presentation of Constant-Amplitude Fatigue Results
3. ASTM E739-10, Statistical Analysis of Stress-Life and Strain-Life Data
4. ISO 1099:2017, Metallic Materials – Axial Force-Controlled Fatigue Testing
5. ISO 12107:2012, Statistical Planning and Analysis of Fatigue Data
6. SAE ARP7488: Peening Design and Process Control Guidelines, issued January 2018
Standards note: Verify the official status and use the full revision invoked by the test plan or contract.
Author: Paweł Kmieć
Discuss a shot peening validation programme: +48 519 772 773 | [email protected]