


Read surface value, maximum compression, depth and zero crossing only after confirming sign convention, location, direction, layer removal, correction and uncertainty
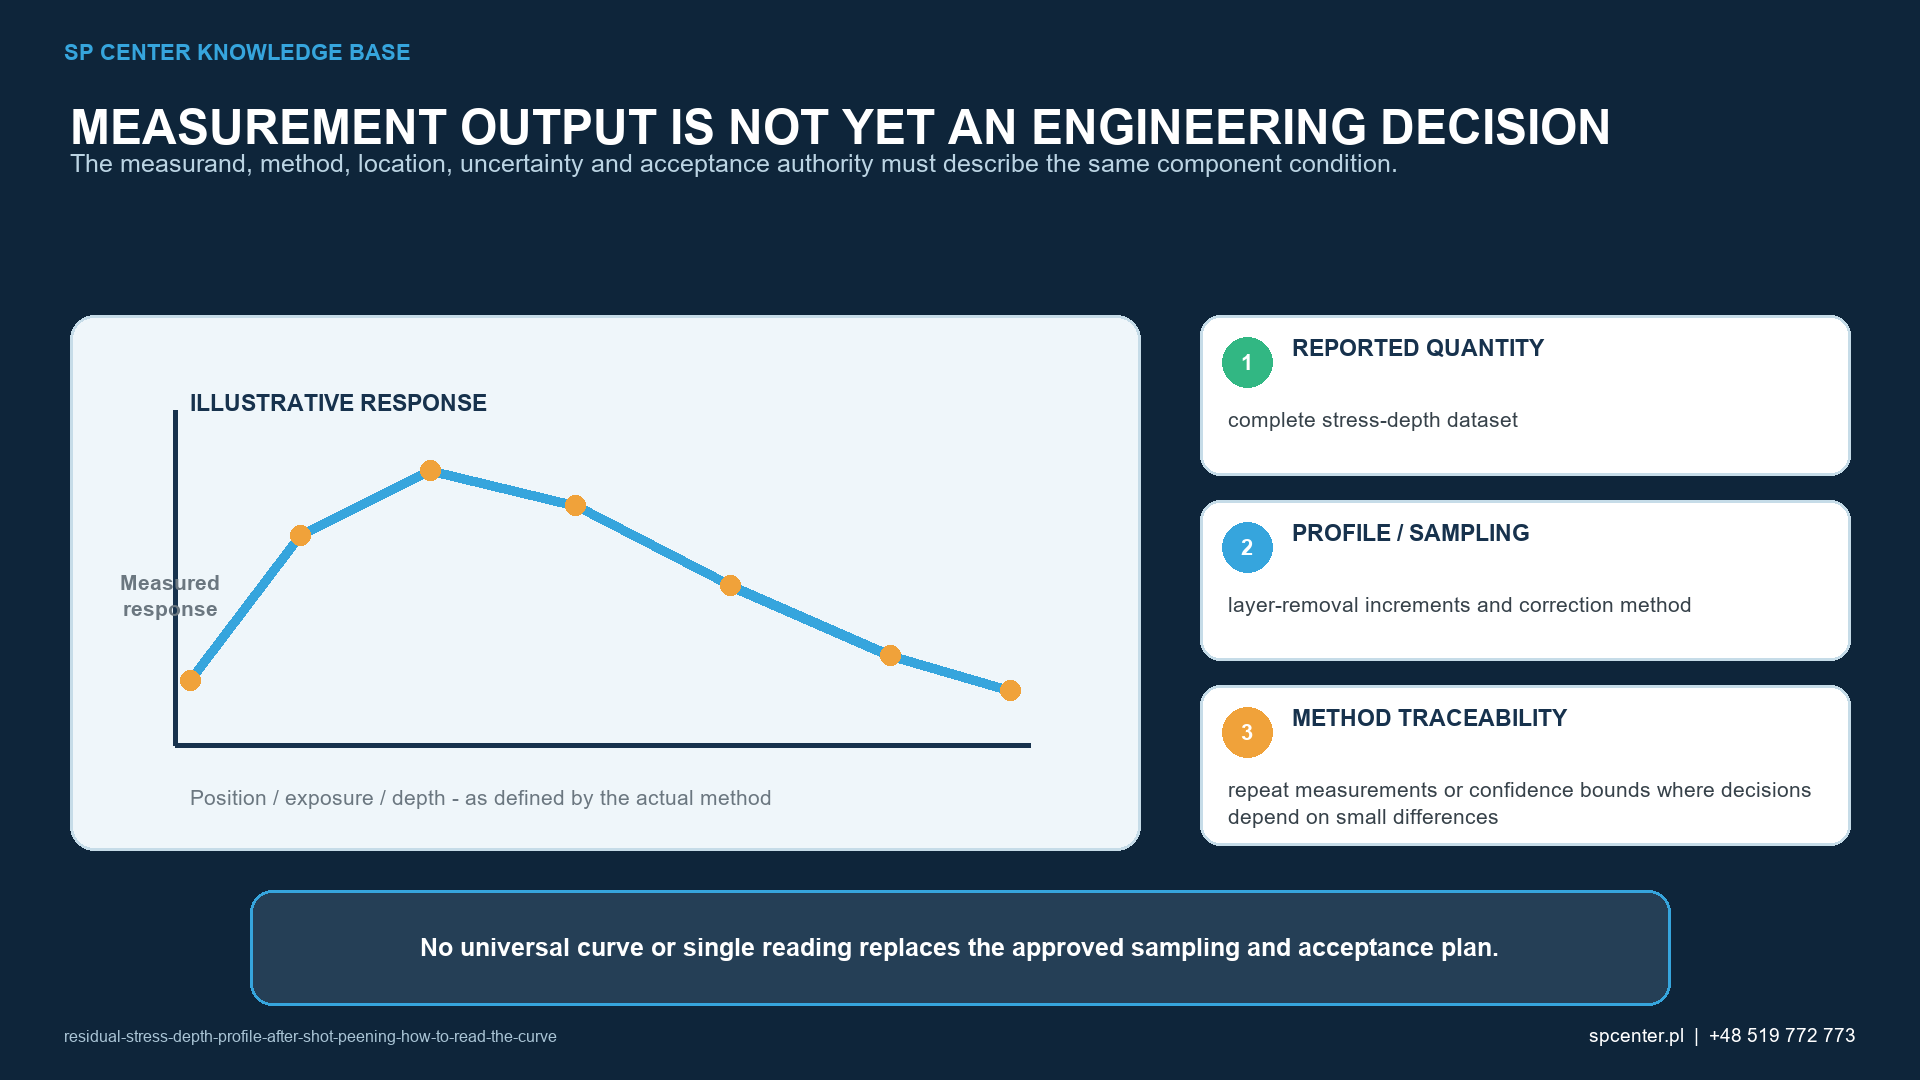
A residual-stress depth profile after shot peening plots a defined stress component against measured distance below the treated surface. It can describe surface stress, the maximum compressive value, its depth and the return toward zero or a balancing region. None of these features can be inferred reliably from Almen intensity alone, and none has meaning without the measurement direction and method.
Which features should be read from the curve?
| Curve feature | Meaning | Interpretation limit |
|---|---|---|
| Surface value | Stress represented by the first measurement at or near the treated surface | The XRD sampling volume is finite; it is not a mathematical point at zero depth |
| Maximum compressive stress | Most compressive reported value under the stated sign convention | A single extreme point may be noise and needs uncertainty review |
| Depth of maximum compression | Depth coordinate of that maximum | Depends on layer increments, origin and curve resolution |
| Zero crossing | Defined depth where the profile reaches the selected zero or reference condition | Interpolation and balancing stress must be specified |
| Depth of compression | Depth range considered compressive under the adopted definition | Not a universal synonym for total affected depth |
| Deeper balancing region | Tensile or less-compressive stress may appear to satisfy equilibrium | May lie beyond the measured range and is geometry dependent |
Table 1. Every curve feature needs an explicit definition before it becomes an acceptance quantity.
Compression is often plotted as negative, but not universally. A reversed sign convention can make two identical physical profiles look opposite. The report should label stress units, depth units, surface origin and sign before any technical comparison.
The most compressive point is not automatically the most important design feature. A drawing or qualification may control surface stress, a minimum compressive value at a specified depth, depth of compression, the complete profile, or another defined quantity.
Why can the maximum occur below the surface?
Shot peening creates a plastic-elastic interaction whose profile depends on material state, media, impact conditions, coverage and geometry. A subsurface maximum is common in many applications, but its position and magnitude are not universal. Surface roughness, prior machining, phase condition and local constraint also affect the reported result.
Do not read the mechanism from curve shape alone. A changed first point can reflect the real process, surface preparation, finite X-ray penetration, texture or measurement quality.
Which measurement details control the profile?
| Measurement input | Why it matters | Record required |
|---|---|---|
| Component location | Fillet, edge, bore and open surface can have different profiles | Drawing reference, coordinates and spot size |
| Stress direction | Longitudinal, transverse and other azimuths need not be equal | Direction, orientation and reported component |
| Radiation and diffraction plane | Material, phase and diffraction peak affect the calculation | Radiation, hkl, method and X-ray elastic constants |
| Layer removal | Actual removed depth defines each subsurface point | Removal method, measured increments and final depth |
| Stress-relaxation correction | Removing material can redistribute the remaining stress | Correction method, geometry assumptions and uncorrected data |
| Uncertainty and quality indicators | Texture, grain size, peak quality and alignment can limit reliability | Fit quality, uncertainty, repeats and instrument verification |
Table 2. A stress value without its direction, diffraction and preparation record is incomplete.
XRD measures lattice strain in a defined crystallographic and geometric arrangement and converts it to stress using appropriate elastic constants and assumptions. Material, phase, texture, grain statistics and peak quality can affect suitability. ASTM E2860 has a specific bearing-steel scope and must not be presented as a universal method for every alloy.
How is depth established?
Successive subsurface readings commonly require controlled layer removal. The report should use the actual measured removal depth rather than only the nominal polishing step. Mechanical removal can introduce stress, so a suitable low-disturbance method is generally selected under the governing procedure.
Removing material can relax and redistribute the stress remaining in the specimen. Where correction is required, report the method and geometry assumptions and retain the uncorrected values. A corrected curve from a thin component should not be compared casually with an uncorrected curve from a massive coupon.
How should two profiles be compared?
| Comparison question | Valid approach | Invalid shortcut |
|---|---|---|
| Did the process change the surface value? | Compare matched locations and directions with uncertainty | Compare only the most favourable point |
| Did the compressive layer become deeper? | Use common depth origin, increments, correction and zero definition | Read depth from differently scaled plots |
| Is one profile better? | Apply the actual design acceptance features and trade-offs | Prefer the curve with the largest compression everywhere |
| Does the curve prove fatigue life? | Correlate with representative fatigue evidence when required | Convert stress directly to universal life gain |
| Can the result be transferred? | Review material, geometry, process and measurement equivalence | Transfer from matching Almen intensity |
Table 3. Common axes are necessary but not sufficient; the complete measurement basis must match.
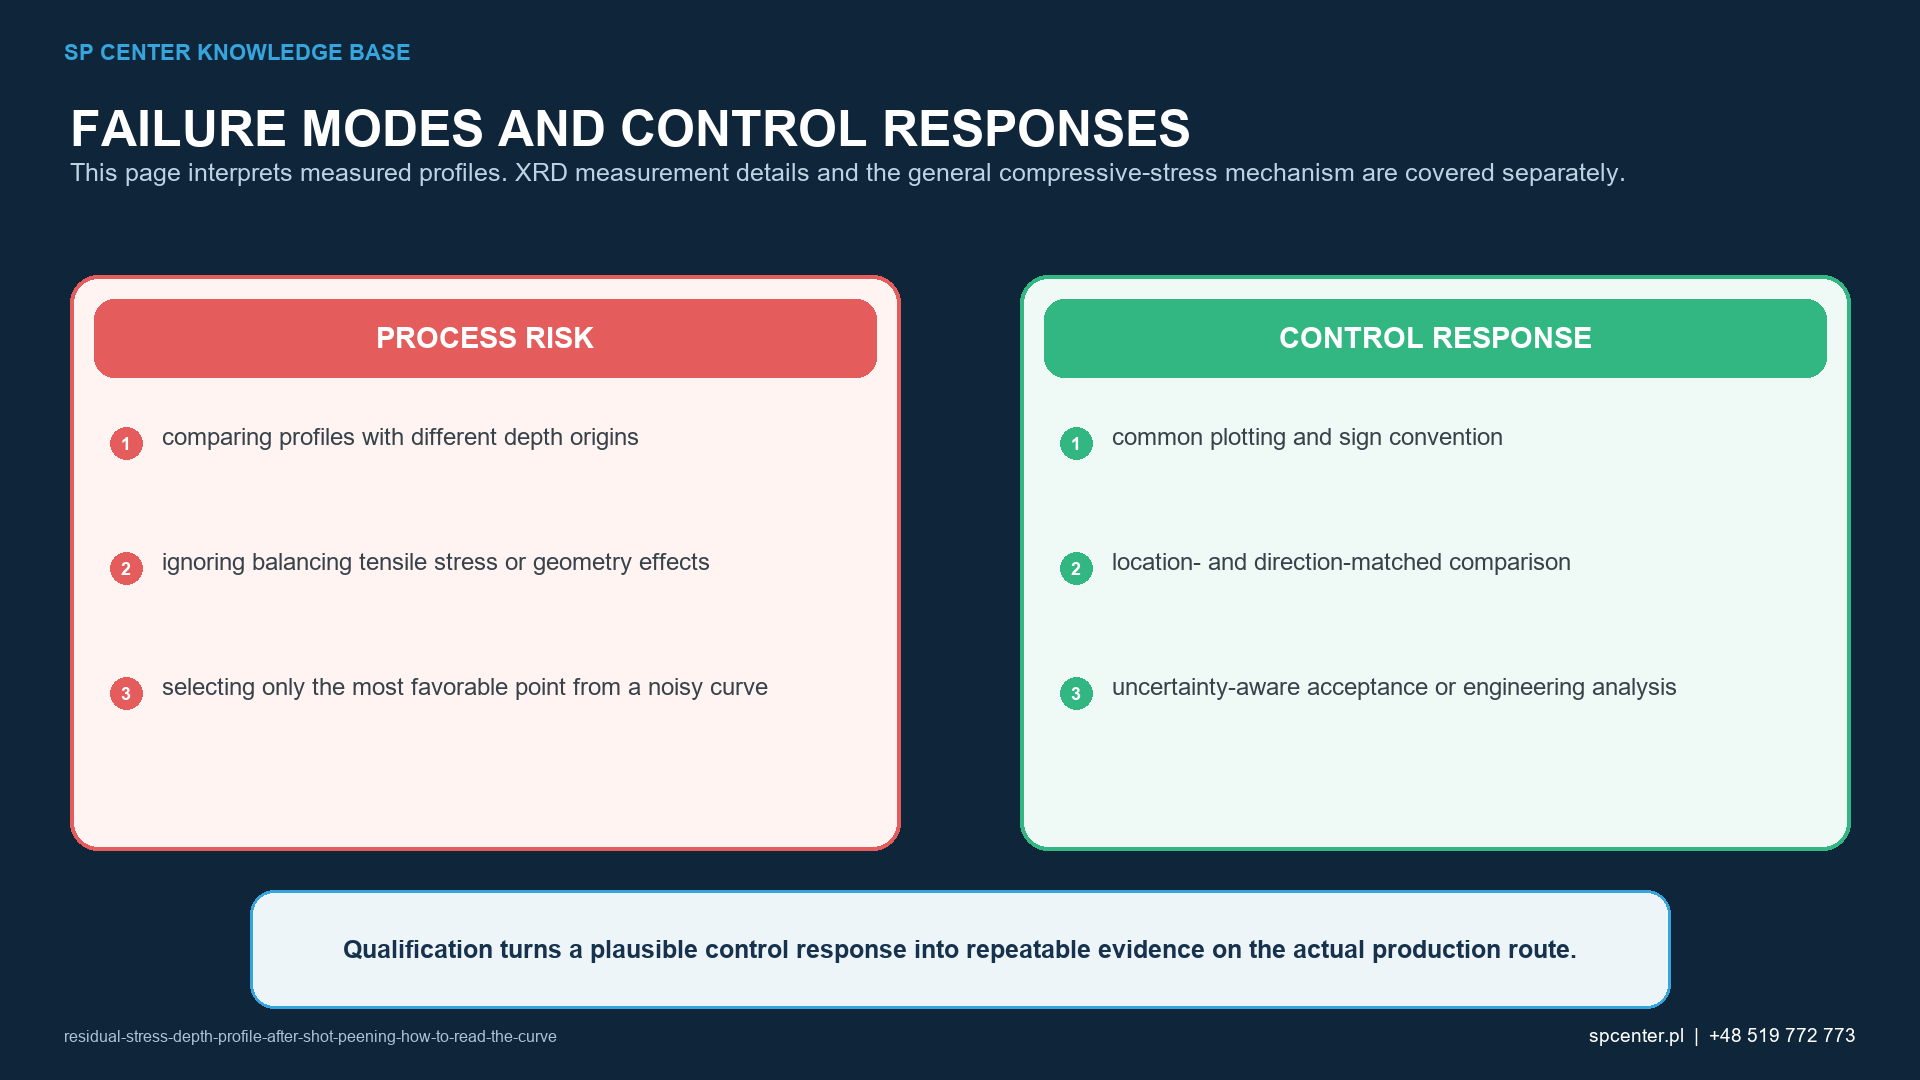
Compare the full datasets, not only a selected minimum. Show points, depth increments and uncertainty or other quality indicators rather than a smoothed line alone. When differences are close to measurement capability, repeat measurements and a predefined decision rule are more defensible than ranking curves visually.
Also compare like-for-like component conditions. Material heat, heat treatment, incoming machining, surface finish, location, peening route and elapsed thermal or mechanical history can all change the profile.
What does the curve not prove?
- It does not prove coverage of the required component zone.
- It does not reconstruct intensity or media condition by itself.
- It does not establish fatigue life without representative validation.
- It does not prove another direction, feature or component has the same stress state.
- It does not authorize extrapolation beyond the measured depth.
- It does not replace surface, dimensional or damage acceptance.
What should a measurement request specify?
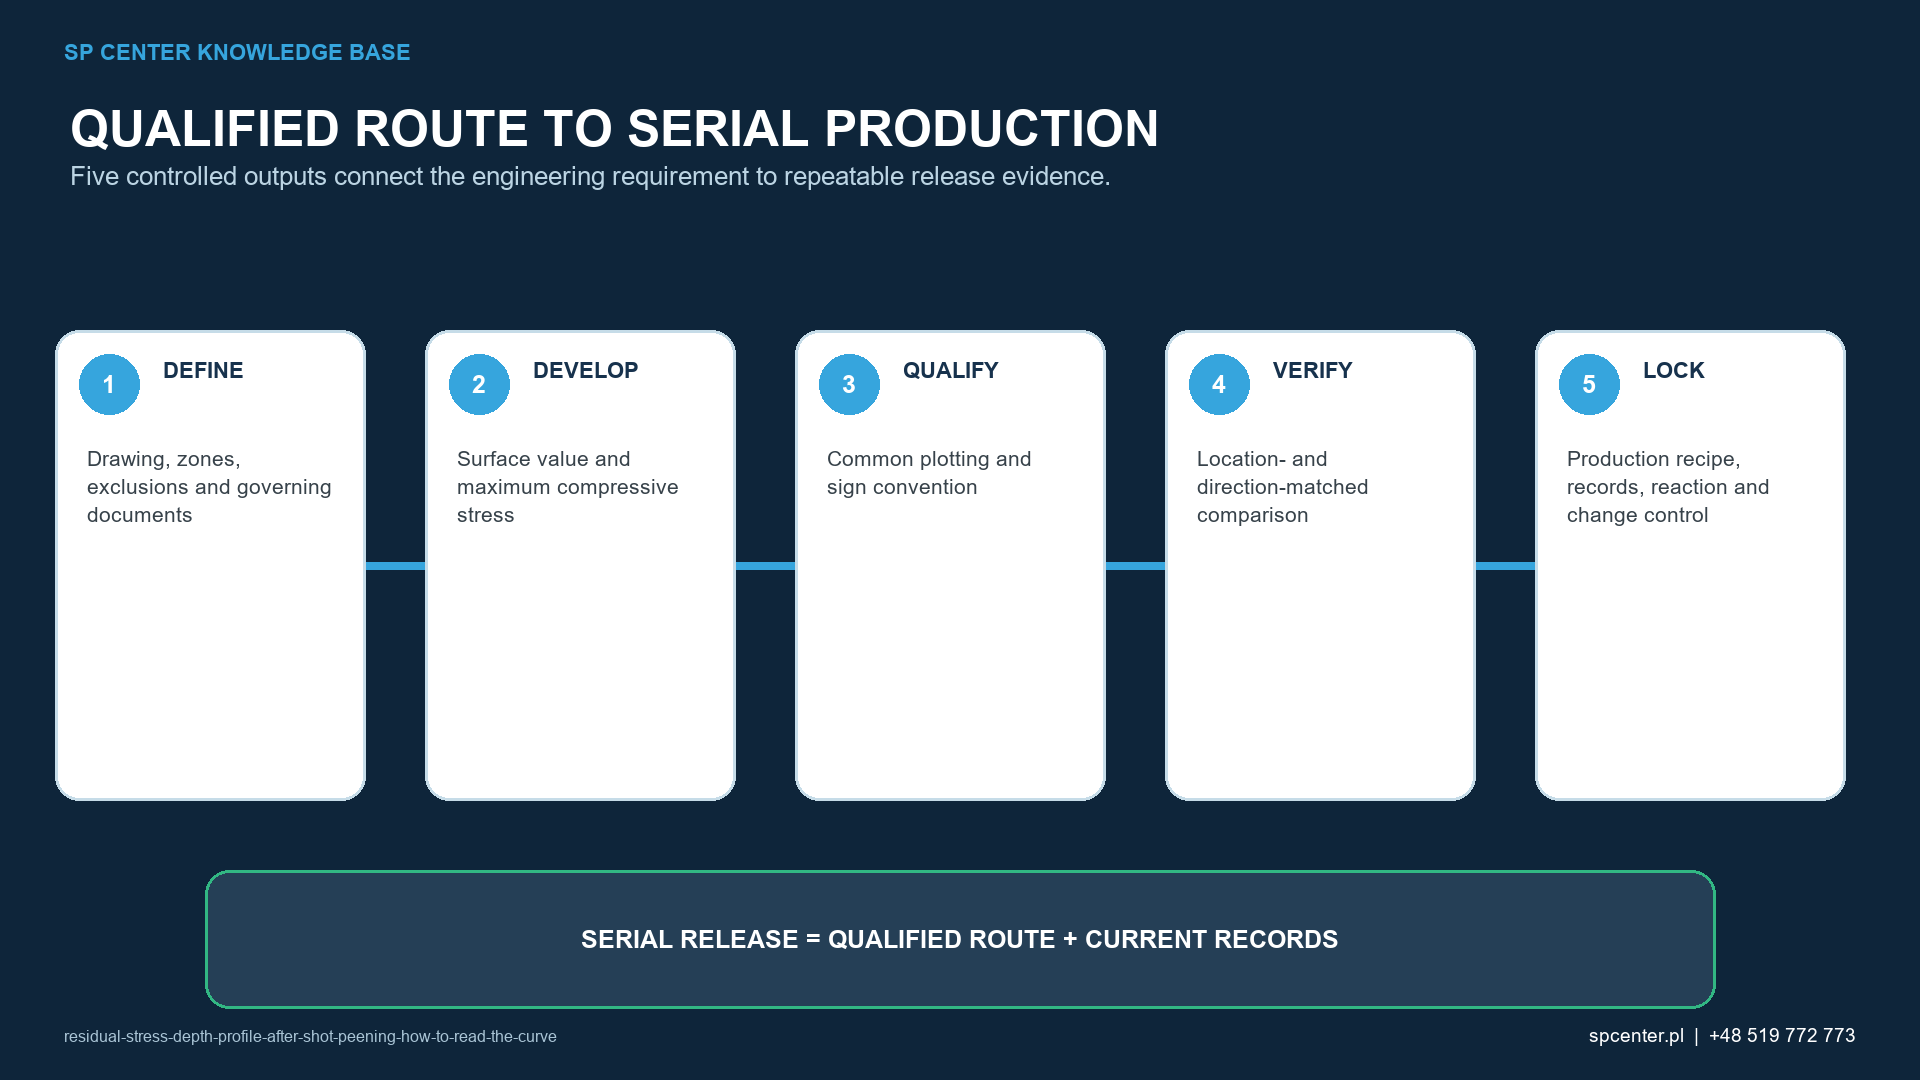
Identify component and revision, material and heat treatment, peening condition, measurement locations and directions, required stress components, depth range and increments, method, radiation and diffraction plane where governed, layer-removal and correction requirements, uncertainty, repeats, raw-data format and acceptance authority.
If the design requirement is unclear, obtain controlled clarification before measuring. Selecting the direction or zero-crossing definition after seeing the results creates a biased acceptance decision.
Frequently asked questions
What does a residual-stress depth profile show?
It shows one or more defined residual-stress components versus measured depth below the treated surface, under a stated measurement, preparation and correction method.
Is compression always plotted as a negative value?
No. Negative compression is common, but some reports reverse the convention. Label the axis and state the sign convention before comparing curves.
What is maximum compressive stress?
It is the most compressive reported value under the stated convention. Its credibility depends on curve resolution, point quality and uncertainty rather than the numerical extreme alone.
What is depth of compression?
It is the depth range classified as compressive under an explicitly defined zero or reference condition. It must not be assumed to mean every material property affected by peening.
Why is material removed for a depth profile?
Laboratory XRD mainly samples a shallow near-surface volume. Controlled layer removal exposes successive depths, but removal can relax stress and may require correction.
Can two XRD profiles be compared directly?
Only when material, location, direction, depth origin, radiation, diffraction plane, layer-removal and correction methods, units and uncertainty are compatible.
Does Almen intensity predict the residual-stress curve?
No universal conversion exists. Intensity characterizes the peening stream; material, media, exposure, geometry and prior condition determine the component profile.
Does a deeper compressive profile always mean longer fatigue life?
No. Service loading, surface condition, stress gradients, defects, geometry and relaxation all matter. A fatigue claim needs application-representative validation.
Key takeaways
- State sign convention, units and depth origin before reading the curve.
- Separate surface value, maximum compression, its depth and defined zero crossing.
- Record location, direction, diffraction method, elastic constants and layer removal.
- Account for measurement uncertainty and any stress-relaxation correction.
- Compare full matched datasets, not favourable points or smoothed lines alone.
- Residual-stress profiles do not replace coverage or fatigue validation.
Related SP Center guides
- XRD Residual Stress Measurement After Shot Peening
- Fatigue Testing After Shot Peening
- Surface Roughness Measurement After Shot Peening
Technical references
4. ASTM E1426-14(2024), X-Ray Elastic Constants for Residual Stress Measurement
5. SAE J2441_202511: Shot Peening, stabilized November 2025
6. SAE ARP7488: Peening Design and Process Control Guidelines, issued January 2018
Standards note: Use the complete method and acceptance requirements invoked by the project. Scope and material applicability must be checked before citing an XRD standard.
Author: Paweł Kmieć
Discuss a residual-stress validation plan: +48 519 772 773 | [email protected]