


Define material, location, direction, diffraction configuration, elastic constants, alignment, uncertainty and layer-removal history before interpreting residual stress after shot peening
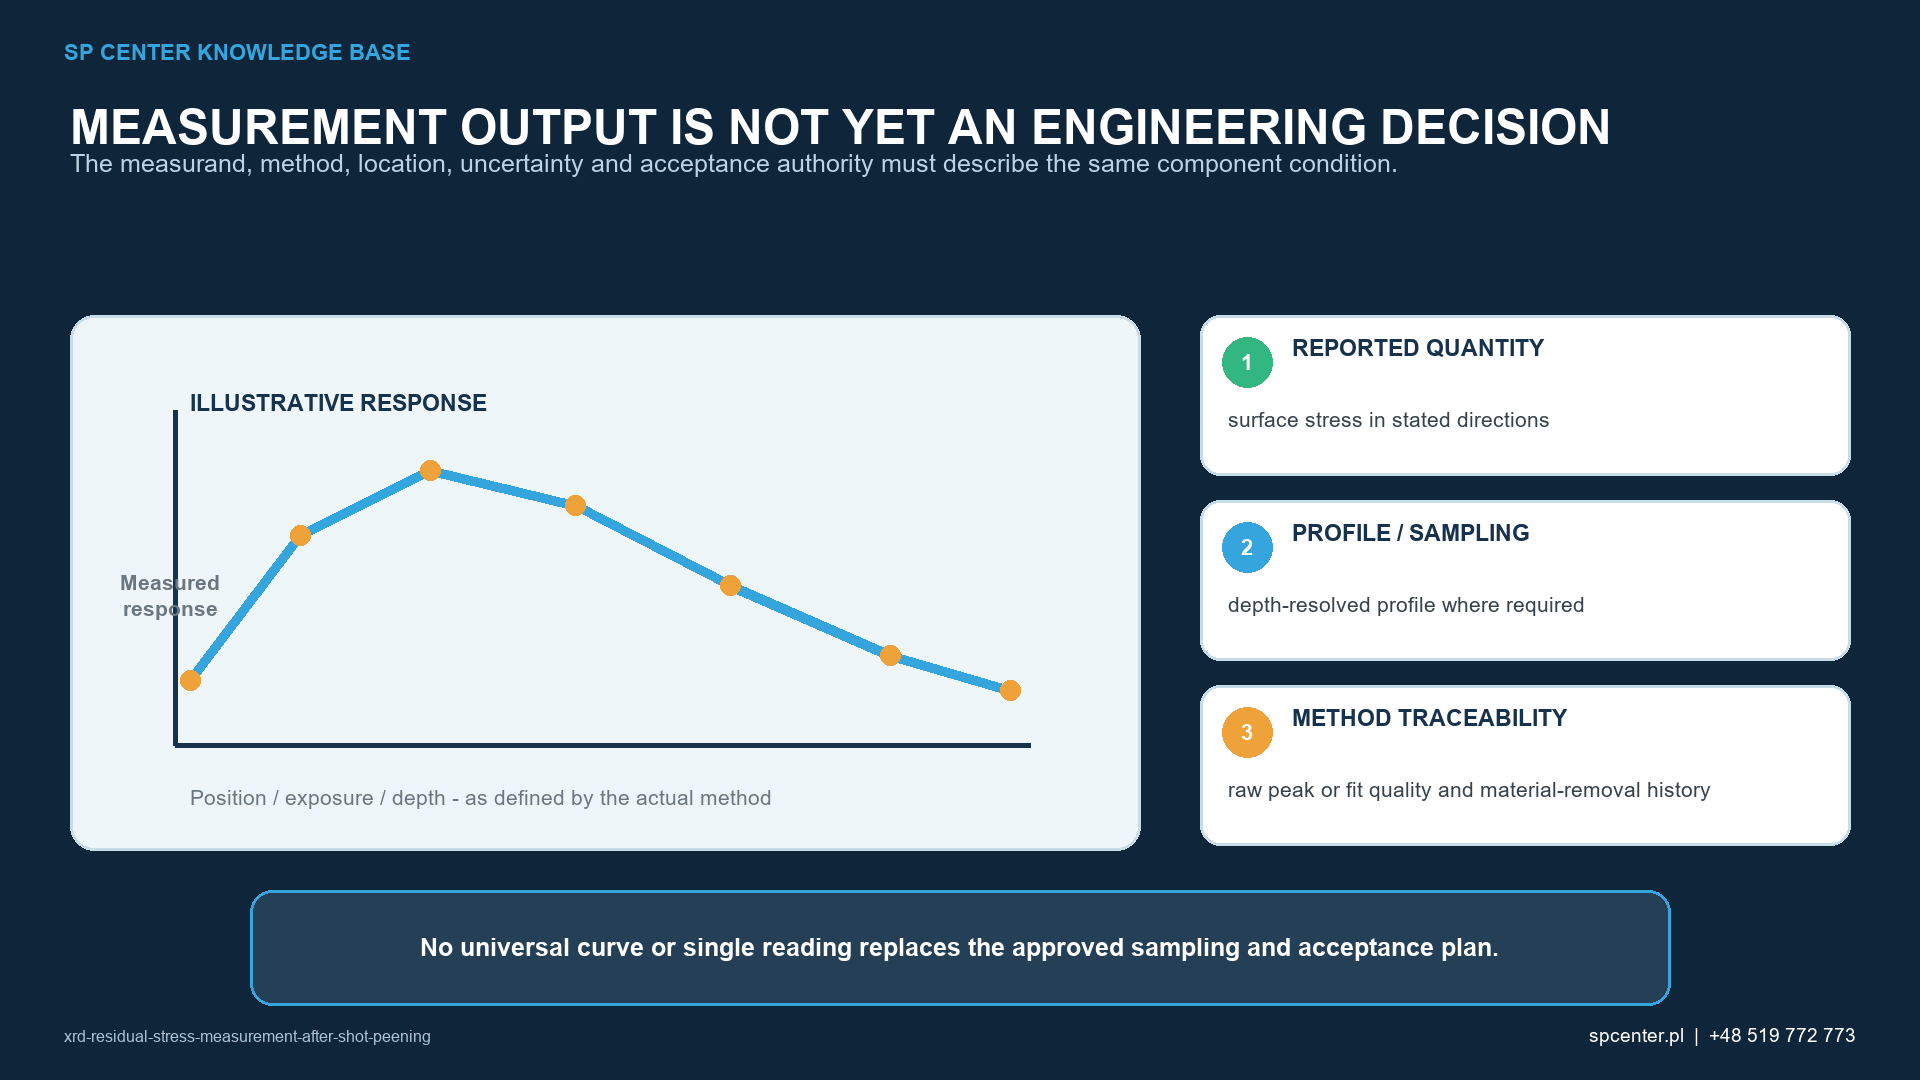
X-ray diffraction (XRD) measures elastic lattice strain in a crystalline material and can be used to calculate direction-specific residual stress in the sampled near-surface volume. After shot peening, the result is credible only when the component location, coordinate system, material phase, diffraction configuration, elastic constants, data quality and uncertainty are stated. A single MPa value without this context is not a defensible residual-stress characterization.
What physical quantity does XRD use?
Diffraction peak position is related to lattice-plane spacing. By measuring that spacing at controlled specimen orientations and applying an appropriate stress-analysis model and X-ray elastic constants, the laboratory estimates selected residual-stress components. The result is not a direct reading from the machine; it is a model-based calculation from diffraction data.
The measured volume depends on material, radiation, diffraction geometry, optics and surface condition. Therefore “surface stress” should be understood as a result for the effective sampled near-surface volume under the stated method, not as a universal zero-depth point.
What must the measurement plan define?
| Measurement-plan item | Why it matters | Minimum report context |
|---|---|---|
| Part and material state | Alloy, phase, heat treatment, texture, grain size, prior processing and peening affect diffraction and stress interpretation | Part/coupon identity, material specification, condition and complete relevant manufacturing route |
| Location and coordinate system | Residual stress is directional and can vary over a fillet, edge, root, bore or mask transition | Drawing-linked location, surface normal, measured azimuths and orientation to the component |
| Diffraction configuration | Radiation, optics, selected reflection and stress method define sampling and conversion from lattice strain | Instrument, radiation, geometry/method, {hkl}, spot/aperture and acquisition settings |
| Elastic constants and stress model | Stress calculation depends on crystallographic elastic response and the assumed stress state | Source and applicability of X-ray elastic constants, stress model and sign convention |
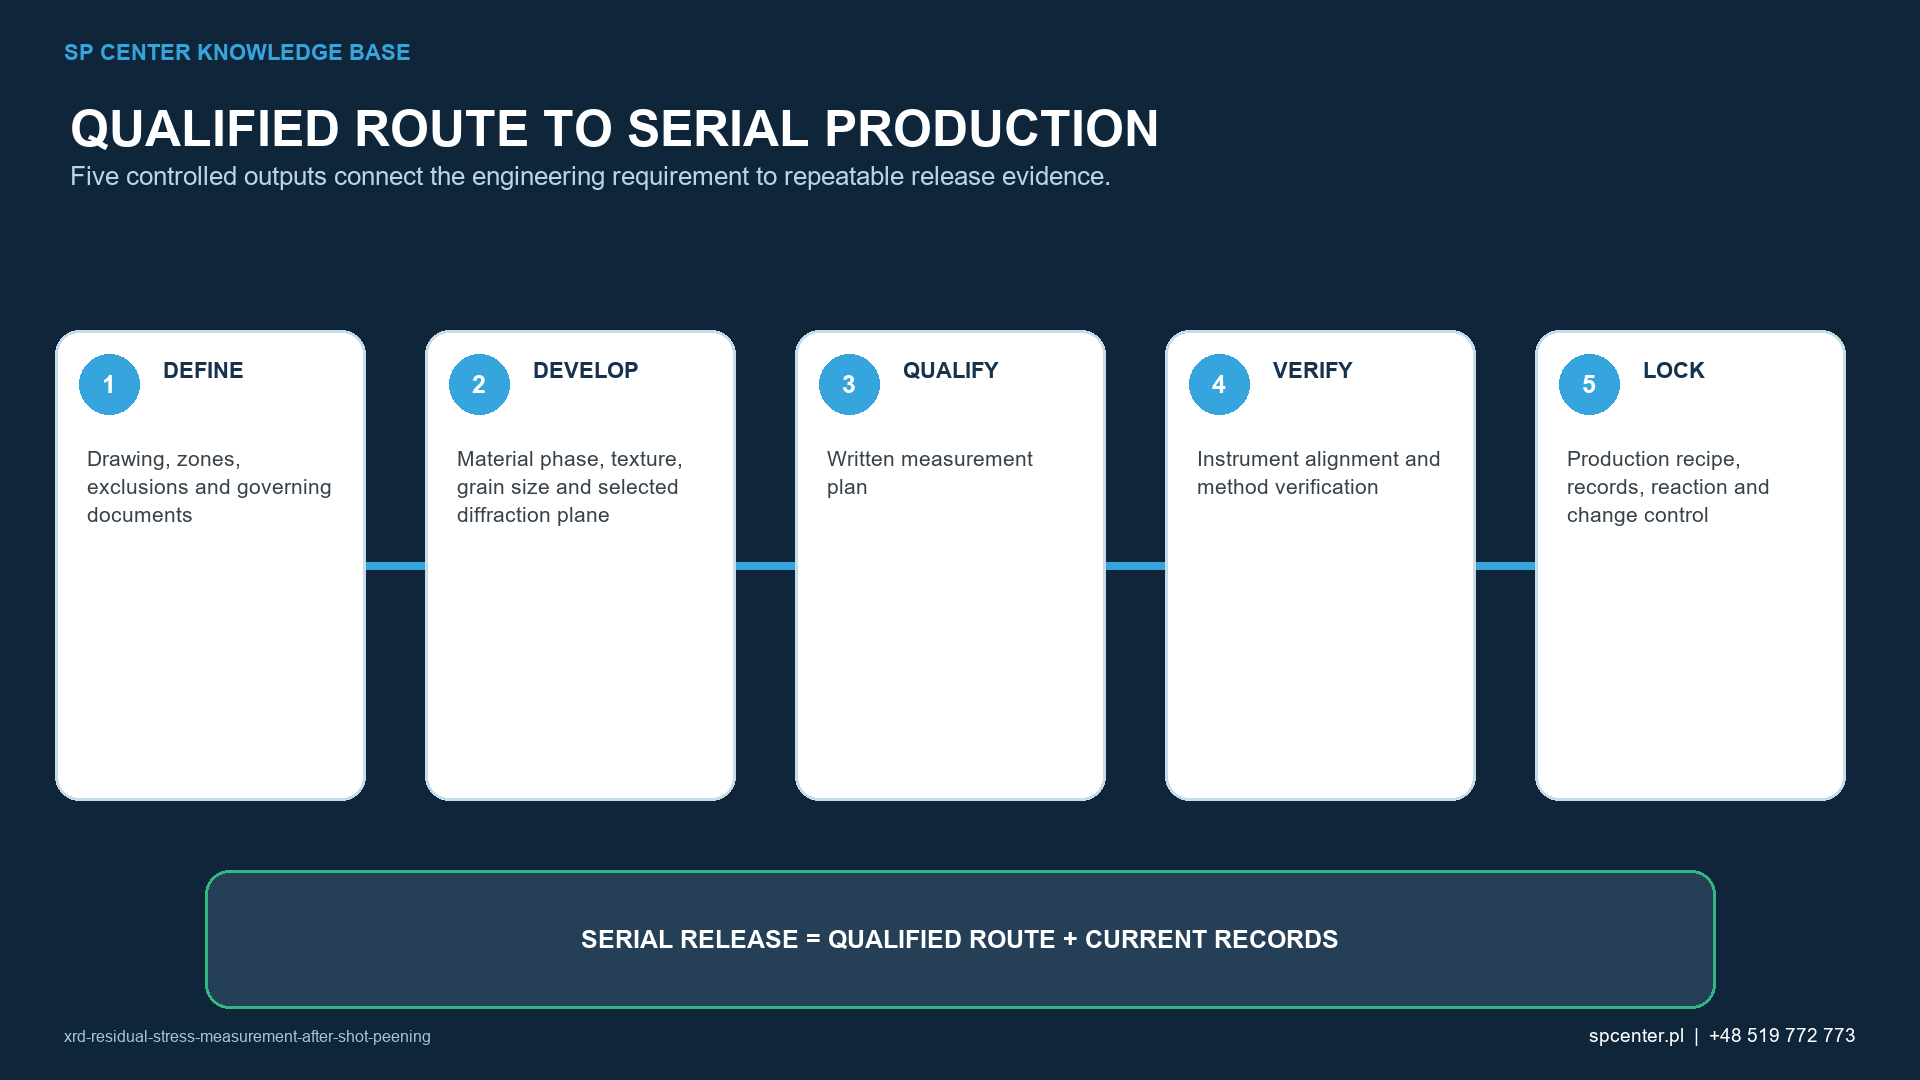
| Alignment and method verification | Misalignment, curved surfaces and position error can create systematic bias | Verification status, reference specimen or procedure, fixturing and alignment checks |
| Peak and fit quality | Texture, coarse grains, multiple phases, roughness or peening broadening can make a numerical fit unreliable | Peak selection, background/fit approach, quality indicators, exclusions and uncertainty |
| Depth-profile procedure | Layer removal changes the measurement position and can redistribute stress | Removal method, actual depth, increments, surface reference, corrections and final uncertainty by depth |
Table 1. Measurement context is part of the result and must be fixed before comparison or acceptance.
The plan starts with the decision the data must support: compare two peening routes, qualify a critical fillet, confirm a depth-profile feature, evaluate thermal relaxation or investigate a nonconformance. Select location, directions and depth range from that question—not from the easiest place to mount the part.
Why do phase, texture and grain size matter?
XRD observes a selected crystalline phase and reflection. Multiphase materials can carry different phase stresses; strong texture changes which grains contribute; coarse grains can provide poor statistics; and severe shot-peening cold work can broaden peaks. Curvature and restricted geometry can also change the illuminated area and alignment sensitivity.
If the selected peak cannot support a stable fit, do not report a software-generated stress number without qualification. Review raw data, alternative reflections or radiation, oscillation/area strategy, spot size and the limits of the method. Any change must remain controlled and comparable to the approved plan.
How is a residual-stress depth profile produced?
Conventional XRD is inherently near-surface. A depth profile is commonly produced by repeating measurements after controlled increments of material removal. The removal route should minimize new mechanical stress; actual removed depth and the new surface position must be measured. Stress redistribution and geometry can require a correction appropriate to the specimen and method.
Layer removal makes the profile locally destructive and can prevent later tests at the same location. Define the maximum depth, increments, reference surface, removal area, masking, depth metrology, correction method and stopping rule before work begins.
Which evidence does XRD provide—and what remains separate?
| Evidence | Question answered | Question not answered alone |
|---|---|---|
| Almen and machine records | Was the qualified peening stream and production configuration verified? | What residual stress exists at a particular component location? |
| Coverage and surface acceptance | Do required areas show accepted impact-impression coverage and allowable surface condition? | What is the residual-stress magnitude or depth profile? |
| Surface XRD result | What direction-specific near-surface lattice-strain-derived stress was measured under the stated method? | How stress varies through depth or whether service life improves |
| XRD depth profile | How the measured residual stress changes with depth at the tested location and directions | Transferability to another material, feature, heat treatment or operating condition |
| Fatigue, SCC or functional validation | Does the defined component system meet the invoked application claim? | Routine control of the peening stream unless the governing requirement explicitly links it |
Table 2. XRD is component characterization or validation evidence, not a routine substitute for peening-stream verification or surface acceptance.
A residual-stress result may be invoked for qualification, design substantiation, process comparison, failure investigation or periodic validation. Whether it is required for production release depends on the drawing, specification and customer system. Do not describe XRD as a universal production control.
How should uncertainty and data quality be handled?
Report the uncertainty relevant to the stated result and the factors included in it. Counting statistics or software fit error alone may not capture alignment, sample position, elastic constants, texture, curvature, layer-depth measurement or between-setup reproducibility. The required decision determines the appropriate uncertainty evaluation.
Retain raw diffraction data, peak fits, rejected points with reasons, instrument and method identifiers, verification status and calculation output. If the method cannot provide a defensible result for the actual material or geometry, state the limitation instead of hiding it behind extra significant figures.
Which reporting failures invalidate comparison?
| Common reporting failure | Technical consequence | Required correction |
|---|---|---|
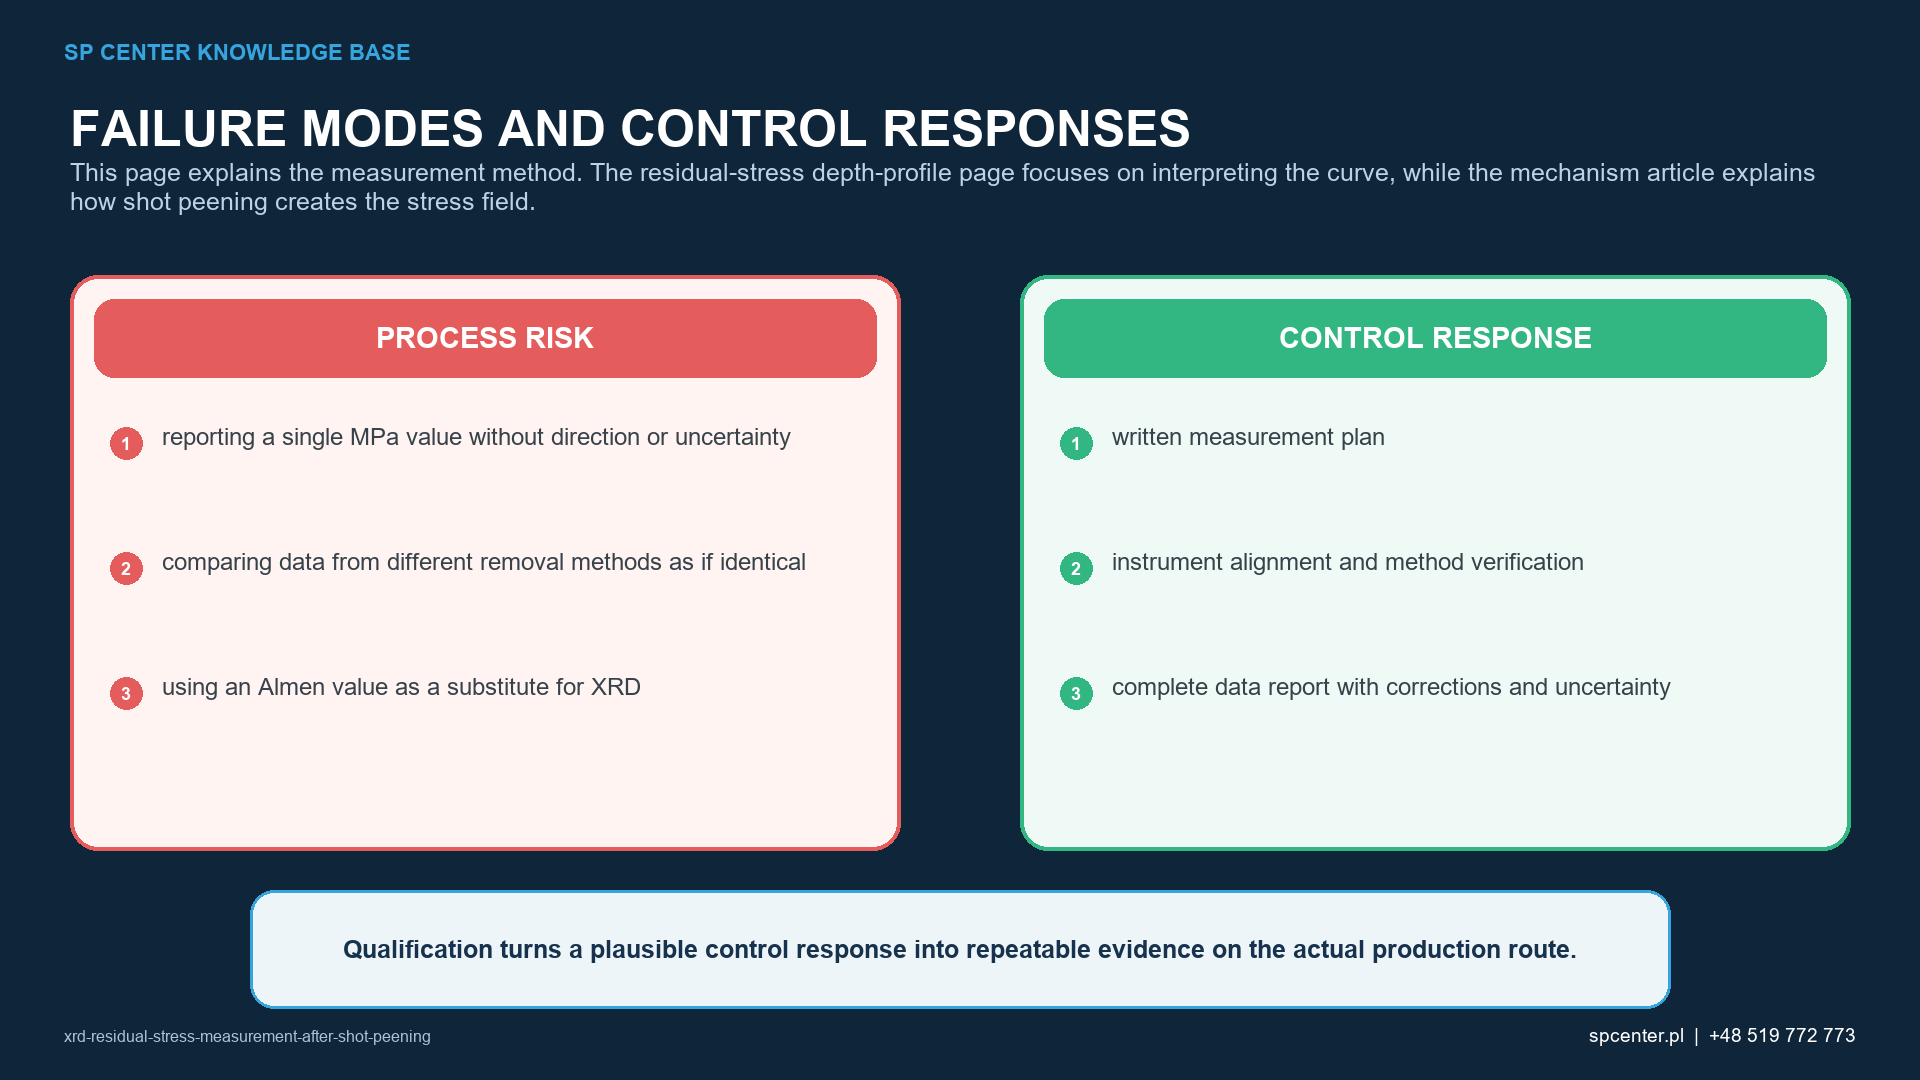
| One MPa value without direction, sign convention or location | The result cannot be related to the component stress state | Report coordinate system, exact location, direction, sign convention and uncertainty |
| Surface result presented as a depth profile | A near-surface sampling result is treated as though the subsurface maximum and crossover were measured | State the effective sampling context or perform a qualified depth-profile procedure |
| Unknown phase, reflection or elastic constants | Lattice strain may be converted using an inappropriate material response | Identify phase/{hkl}, constants, source and applicability |
| Poor fit accepted because software returned a number | Coarse grains, texture, overlap or broadening can hide an invalid result | Review raw diffraction data, fit quality and method limitations; repeat or change the qualified method |
| Different layer-removal procedures compared as equivalent | Depth, redistribution and surface preparation differences can bias comparison | Use the same controlled method or document and quantify the method difference |
| Coupon result transferred directly to a complex part | Geometry, orientation, surface condition and peening access may not be representative | Establish and document representativeness or measure the actual feature |
Table 3. Comparability requires the same defined measurand and sufficient method context, not merely the same unit.
How should XRD results be compared?
Compare like with like: same alloy and phase, heat treatment, surface condition, location, direction, diffraction configuration, elastic constants, spot size, depth procedure and data-reduction logic. If any item differs, identify it and assess whether a quantitative comparison remains valid.
For a peening study, retain the complete route from incoming part through media, intensity, coverage, fixture, motion, cleaning and any subsequent heat or finishing. XRD does not identify which process variable caused a difference unless the experimental design and records isolate that variable.
What belongs in an XRD report?
- Part or coupon identity, drawing location, material, phase, heat treatment and relevant process history.
- Coordinate system, measured directions, exact locations, surface condition and preparation.
- Instrument, radiation, optics, stress method, selected reflection, aperture/spot and acquisition settings.
- X-ray elastic constants, source, stress model and sign convention.
- Alignment or method-verification status and relevant reference checks.
- Raw/processed diffraction quality, fit method, excluded data and acceptance limitations.
- Stress result with units and uncertainty for each location, direction and depth.
- For depth profiles: removal method, actual depth increments, depth uncertainty, corrections and remaining thickness/geometry as relevant.
- Authorized deviations, laboratory identity and technical approval of the report.
What does XRD measure after shot peening?
XRD measures changes in crystallographic lattice spacing at defined orientations. With an appropriate method and elastic constants, those strains are used to calculate direction-specific residual stress in the sampled near-surface volume.
Is XRD residual-stress measurement nondestructive?
A surface measurement can be nondestructive when no material is removed and preparation does not alter the part. A depth profile normally uses sequential layer removal and is therefore locally destructive unless another qualified method is specified.
Does XRD replace Almen intensity testing?
No. Almen testing verifies a standardized response of the peening stream. XRD characterizes residual stress in a selected material and component location. The methods answer different questions.
Does XRD prove shot-peening coverage?
No. Coverage is assessed from impact-impression evidence on the required surface using the approved method. XRD sampling does not establish complete coverage boundaries or mask transitions.
Why must measurement direction be reported?
Residual stress is a tensor quantity and the in-plane components can differ. A value without the measured azimuth or component coordinate system cannot be interpreted or compared defensibly.
Why can shot-peened surfaces be difficult to measure by XRD?
Roughness, severe cold work, peak broadening, texture, coarse grains, multiple phases, curvature and restricted access can degrade diffraction statistics or create bias. The method and uncertainty must address the actual condition.
Can one surface value represent the full residual-stress profile?
No. The maximum compressive stress may be below the surface, and the profile changes with depth. A depth claim needs a qualified depth-resolved measurement or another method suitable for that claim.
Does a compressive XRD result guarantee longer fatigue life?
No. Fatigue response also depends on material, geometry, surface defects, roughness, load spectrum, environment and residual-stress stability. A life claim requires representative functional validation.
Key takeaways
- XRD calculates direction-specific stress from measured lattice strain; it does not directly read stress.
- Location, direction, phase, reflection, elastic constants and uncertainty are part of every result.
- A surface value is not a complete depth profile.
- Layer-removal profiles are locally destructive and need controlled depth and correction records.
- Raw diffraction and fit quality must support the reported number.
- XRD characterizes the component state; Almen intensity, coverage and fatigue validation remain separate evidence.
Related SP Center guides
- Residual Stress Depth Profile After Shot Peening
- Fatigue Testing After Shot Peening
- Surface Roughness Measurement After Shot Peening
- Almen Intensity in Shot Peening
Technical sources
4. SAE J2441_202511: Shot Peening, stabilized November 2025
Standards note: ASTM E2860-20 has a stated bearing-steel scope and must not be presented as a universal method for every alloy. Apply the complete method, drawing, customer requirements and invoked revisions; this article does not reproduce their detailed procedures.
Author: Paweł Kmieć
Discuss residual-stress evidence for a shot-peening project: +48 519 772 773 | [email protected]