


Protect exposure and arc-height data, validate the calculation and keep every result traceable to strip, holder, machine, media and software version
SAE J2597 defines a procedure for computer-generated shot-peening saturation curves used to determine peening intensity. SAE publicly lists J2597_201709 as reaffirmed. The method supports consistent evaluation of a valid dataset and requires the calculated result to meet the applicable tolerance; it cannot correct a wrong strip system, poor measurements or an unrepresentative holder location.
How does J2597 relate to J442 and J443?
J442 defines requirements for the tools and supplies used in peening-intensity determination and verification. J443 defines the current procedures for deriving and verifying peening intensity. J2597 addresses the computer-generated saturation-curve calculation. The three documents have related but different scopes.
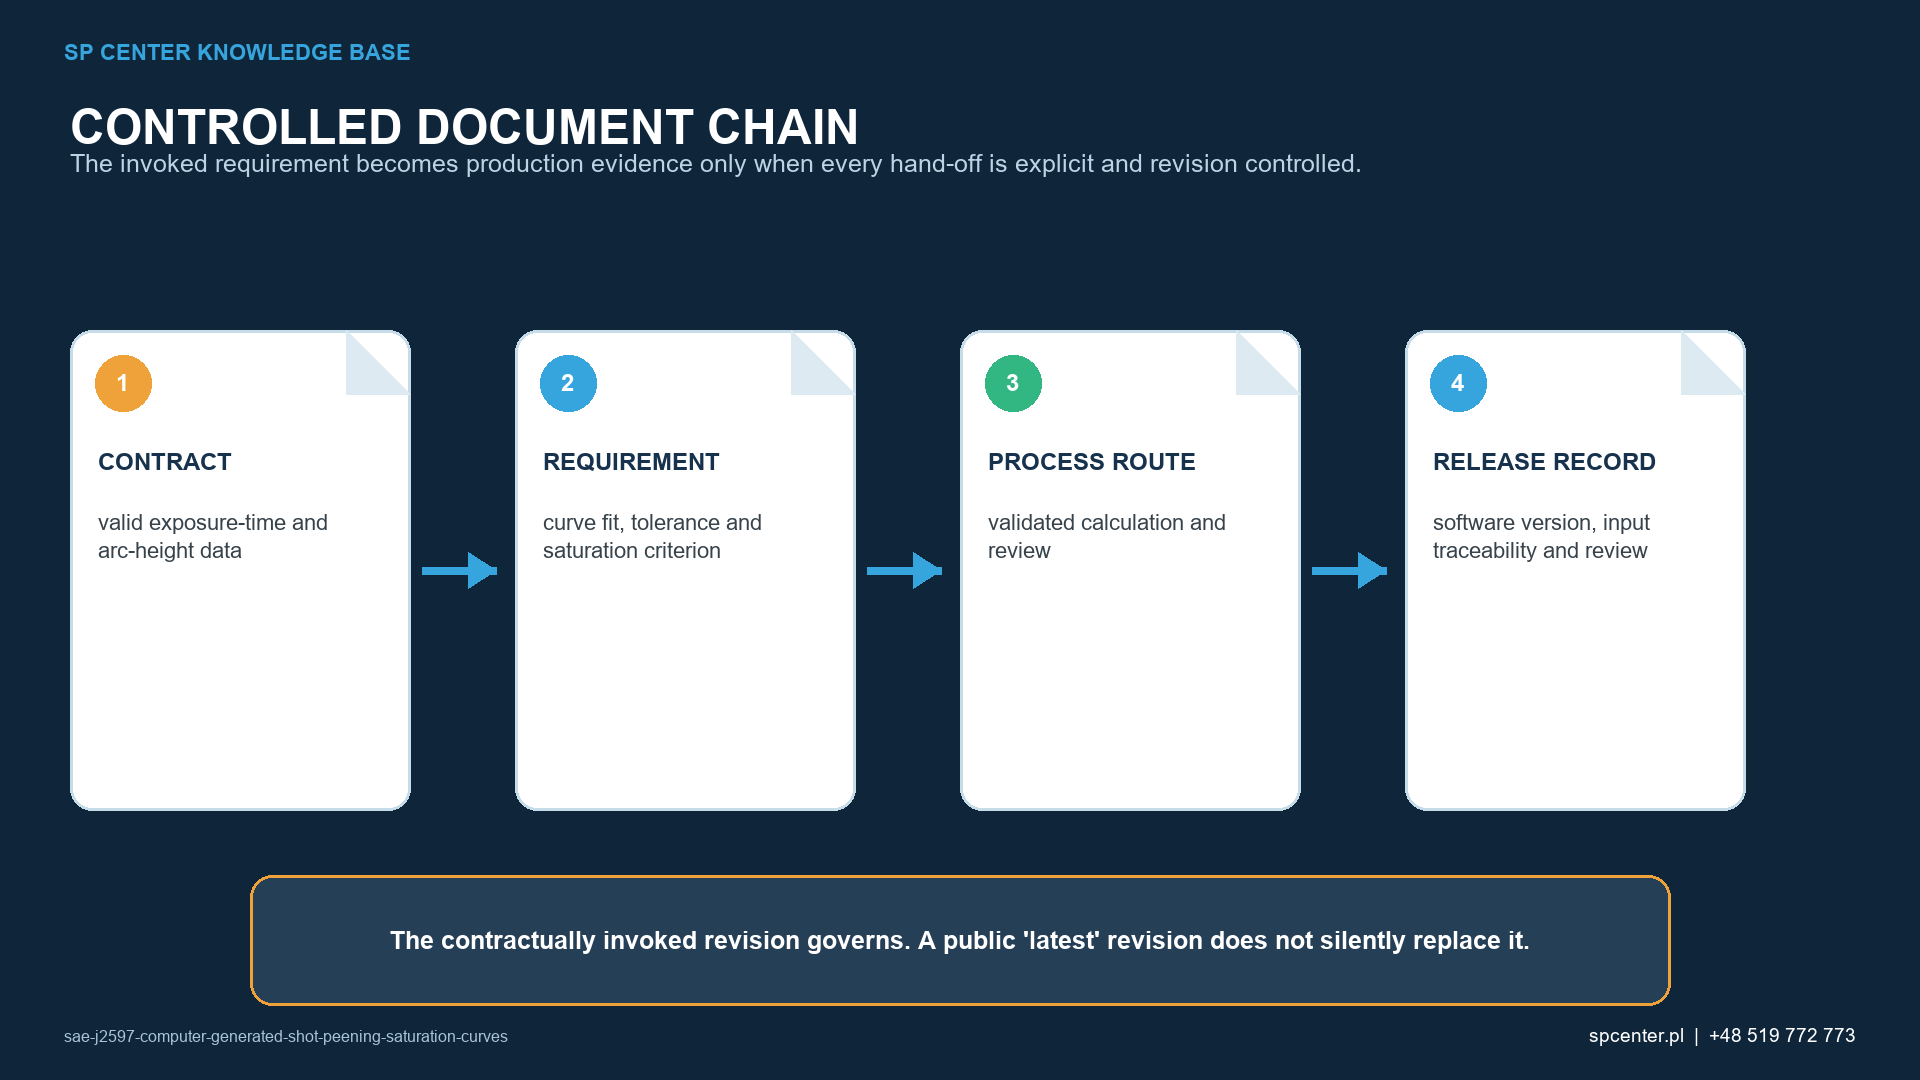
The drawing, contract or customer can invoke a particular revision or additional requirement. A public “current” status does not automatically replace the controlled revision in the job unless the contractual system authorizes that change.
Which inputs must be controlled?
| Input | Required context | Failure if missing |
|---|---|---|
| Exposure value | Actual controlled time, passes or other permitted exposure measure | Points are placed on the wrong horizontal scale |
| Arc height | Unrounded reading from a verified gauge and acceptable strip | The fit reflects transcription or resolution error |
| Strip designation | Applicable N, A or C system and strip identity | Numerically similar values are interpreted on the wrong system |
| Holder and location | Approved holder orientation and machine position | The curve does not represent the required stream location |
| Process configuration | Machine, media, pressure or wheel settings, flow, nozzle or wheel and motion | The result cannot be traced or repeated |
| Software identity | Validated tool, version, algorithm configuration and units | The calculation cannot be reconstructed |
Table 1. A curve is only as defensible as its raw measurements and configuration link.
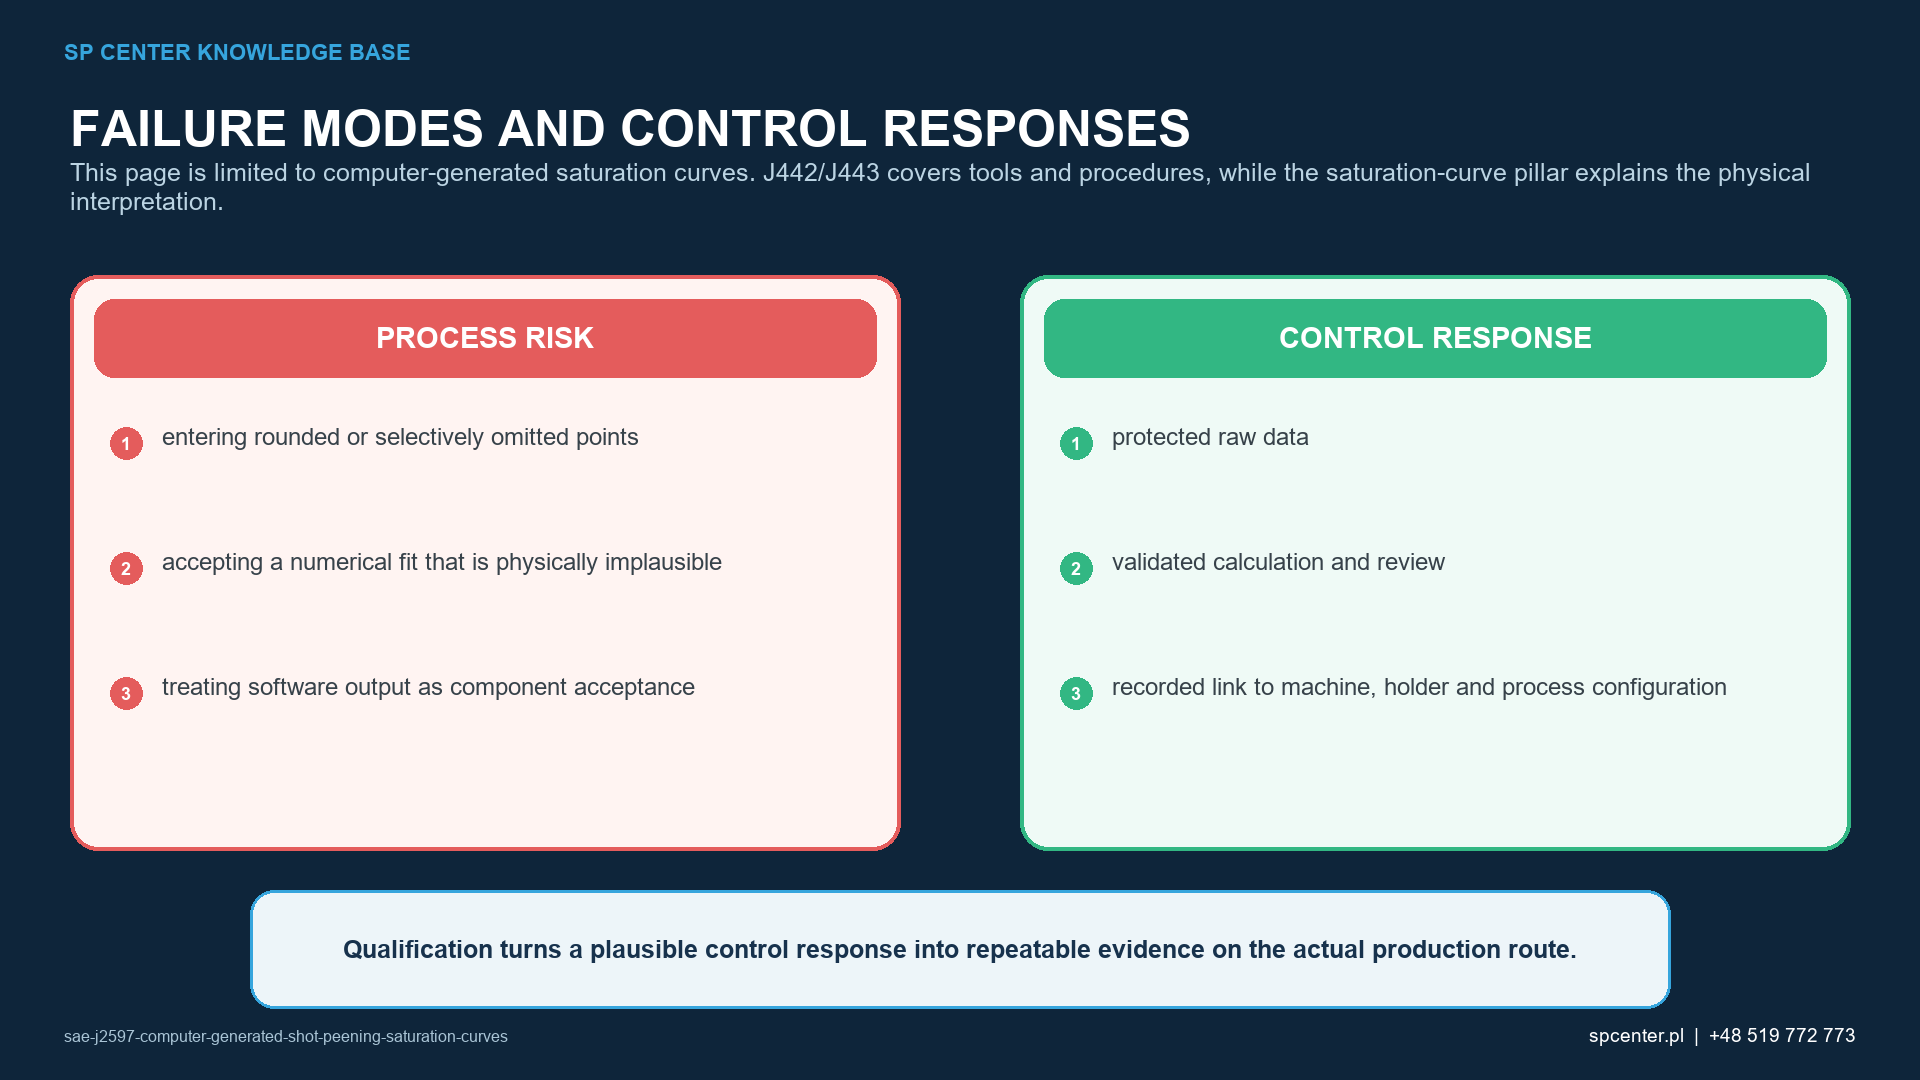
Use the actual measured values and preserve their units and resolution. Do not silently convert time, reorder runs, mix strip designations or copy readings from another holder. If a run is invalid, retain the original record and document the technical reason and authorized repeat.
What does the computer-generated curve calculate?
The calculation fits the exposure and arc-height dataset and determines intensity through the procedure defined in J2597. This guide does not reproduce the copyrighted algorithm, tolerance bands or reference datasets. The complete standard remains the authority.
Intensity is associated with the saturation condition defined by the invoked procedure; it is not simply the highest arc-height reading or the last point on the curve. Software output that contradicts the visible physical trend requires investigation rather than automatic acceptance.
How should the dataset and result be reviewed?
| Review stage | Question | Objective evidence |
|---|---|---|
| Data integrity | Are all valid points retained exactly as measured? | Protected raw readings, run order and any documented invalid run |
| Physical plausibility | Does arc height rise toward saturation without unexplained behaviour? | Displayed points and fitted curve with technical review |
| J2597 calculation | Does the computer-generated result meet the applicable standard tolerance? | Calculated intensity, tolerance result and reference-dataset validation |
| Configuration link | Does the curve belong to the intended holder and process state? | Machine, media, tooling, programme and setup records |
| Independent approval | Was the result reviewed before use? | Reviewer identity, date and controlled release status |
Table 2. Numerical acceptance and technical plausibility are both necessary.
Selective deletion, premature rounding and hidden unit conversion can move the calculated result. Reviewers should see the points and fitted curve, not only a pass/fail cell. A valid technical reason for excluding a measurement must be recorded independently of whether exclusion improves the result.
When the curve fails or behaves unexpectedly, investigate strip handling, gauge verification, holder condition, run order, machine state, media and transcription. Do not add arbitrary points or change exposure values to make the fit pass.
How is the software implementation validated?
Validate the implementation against the reference datasets and permitted tolerance in the complete J2597 document. Control formula or code, units, version, access rights and change history. Revalidate after a change that can affect calculation or output.
A commercial tool is not automatically valid because of its brand, and an internal spreadsheet is not invalid merely because it is a spreadsheet. The evidence is the controlled implementation, correct reference outcomes, protection against unintended edits and traceable review.
What does a passing result prove?
| Output | What it supports | What it does not prove |
|---|---|---|
| Fitted saturation curve | Consistent evaluation of the submitted intensity dataset | That every data point was valid or representative |
| Calculated intensity | Peening intensity for the tested configuration under the invoked method | Component coverage or residual stress |
| Tolerance result | Whether the calculation meets the J2597 dataset criterion | Compliance with every customer specification |
| Software validation | The implementation reproduces accepted reference outcomes | That current production inputs were correct |
| Approved record | Traceable basis for the stated intensity decision | Automatic transfer to another machine, holder or part |
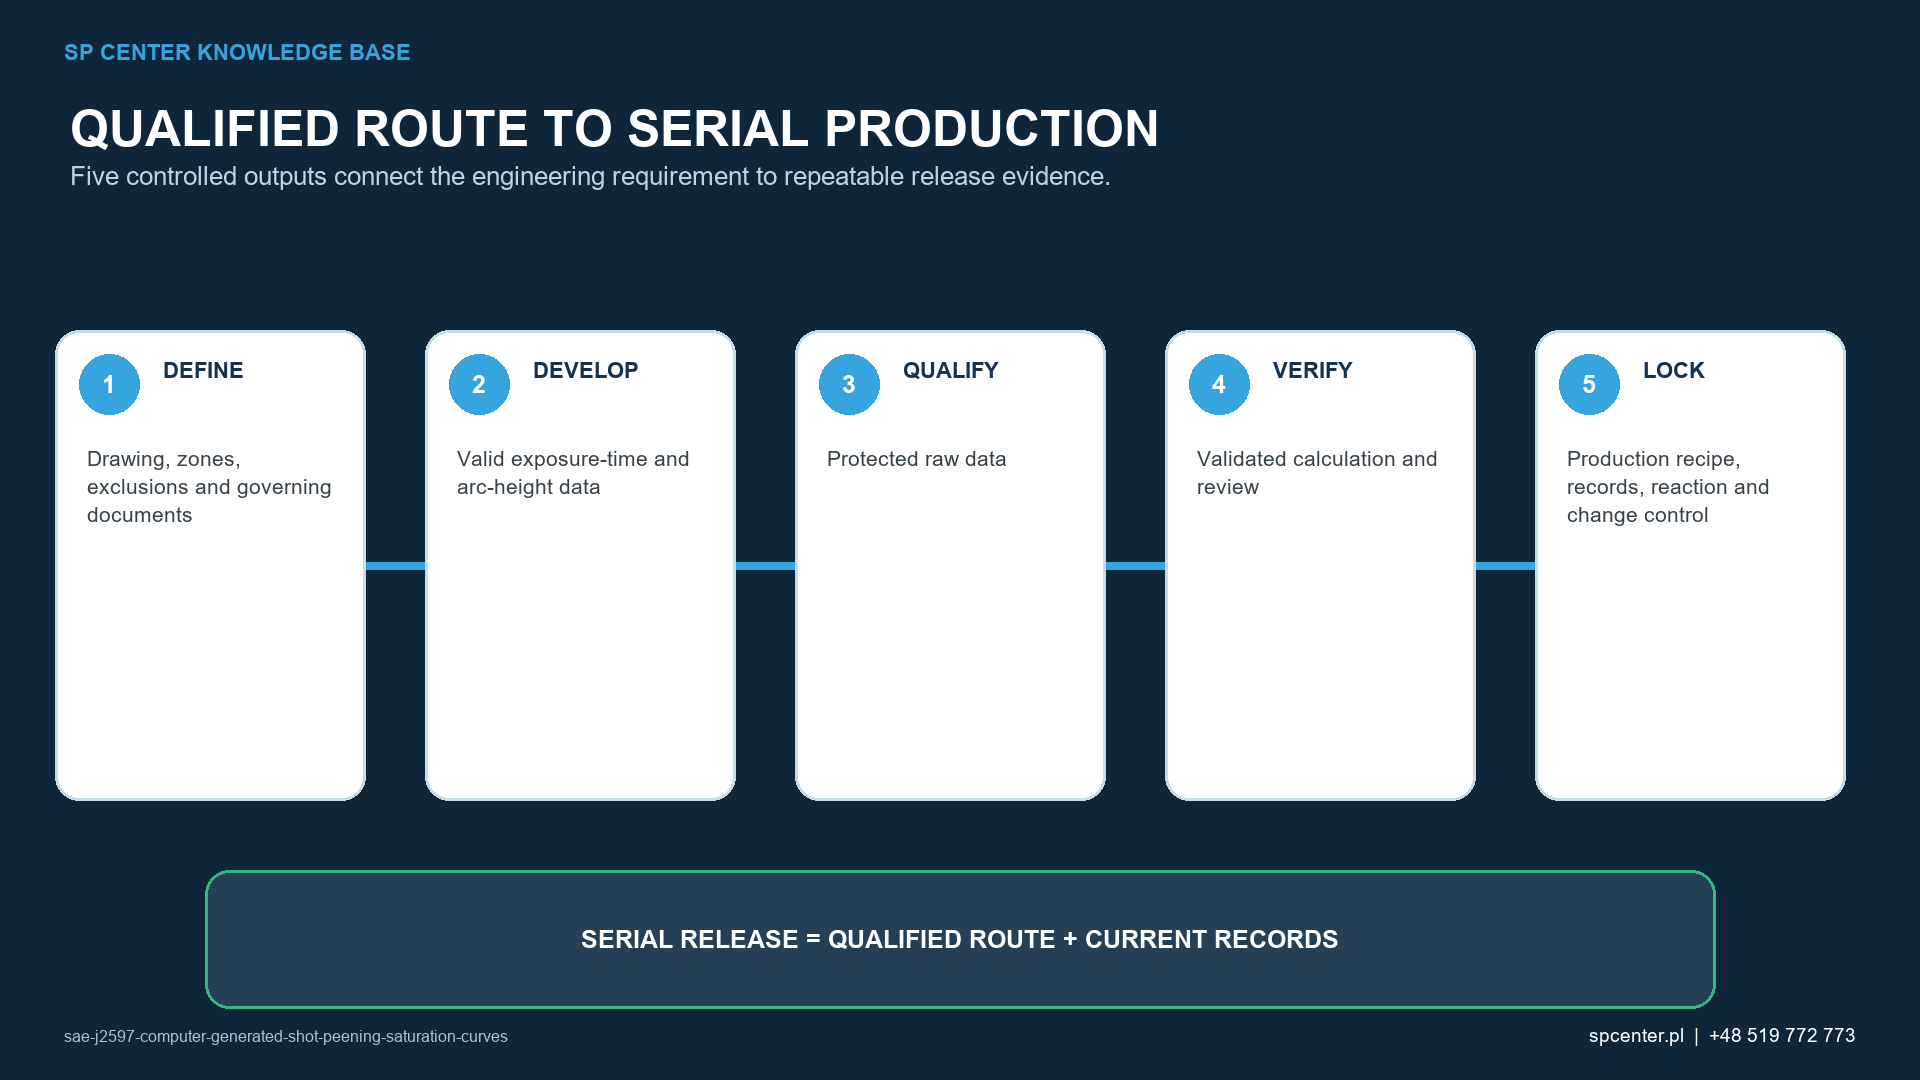
Table 3. J2597 supports intensity determination and does not turn the curve into component acceptance.
Almen intensity characterizes the peening stream under standardized conditions. Coverage concerns impact evidence on the required component surface. Roughness, dimensions, residual stress and fatigue response remain separate outputs when invoked.
Which records should be retained?
- Job, machine, holder, location and configuration identity.
- Strip designation, lot or identity, condition and gauge verification status.
- Exposure values, arc heights, units, run order and raw entries.
- Media, operating settings and relevant machine-state records.
- Software name, version, controlled calculation and reference validation.
- Displayed points, fitted curve, calculated intensity and tolerance status.
- Invalid runs, repeats, deviations and reviewer approval.
The required retention time and release package follow the governing contract, specification and quality system. J2597 output alone does not define every production record.
Frequently asked questions
What does SAE J2597 cover?
It defines a procedure for using computer-generated saturation curves to determine peening intensity and requires the calculated intensity to meet the applicable tolerance for the dataset.
What is the current public SAE listing?
SAE lists J2597_201709 as reaffirmed. The contract may invoke a specific revision, so the complete controlled requirement must still be checked.
Does J2597 replace SAE J442 or J443?
No. J442 addresses the tools used for intensity determination and verification, J443 defines current intensity procedures, and J2597 addresses computer-generated saturation-curve evaluation.
Can a spreadsheet be used?
Only when the organization has established that the implementation, units, protected formulas, reference results, version control and review meet the invoked requirements.
Can an outlier be deleted to improve the curve?
Not selectively. Investigate the measurement and process event, retain the raw record and follow the controlled rule for invalid data or rerun decisions.
Should arc-height readings be rounded before entry?
Enter and retain data at the resolution required by the controlled method. Premature rounding can alter the fit and tolerance outcome.
Does a passing J2597 curve prove coverage?
No. It supports an intensity decision. Component coverage, surface condition, dimensions and application performance require their own invoked evidence.
What should the result record contain?
Retain raw data, units, strip and holder, machine and media configuration, software and version, curve, calculated result, tolerance status, exceptions and reviewer approval.
Key takeaways
- J2597_201709 is the reaffirmed public SAE listing for computer-generated saturation curves.
- J442, J443 and J2597 have complementary, not interchangeable, scopes.
- Protect raw exposure and arc-height data and retain all authorized exceptions.
- Validate software against the complete standard’s reference data and tolerance.
- Review physical plausibility as well as the numerical output.
- A passing curve supports intensity but does not prove coverage or component performance.
Related SP Center guides
Primary technical sources
1. SAE J2597_201709: Computer Generated Shot Peening Saturation Curves
2. SAE J442_202602: Tools for Peening Intensity Determination and Verification, revised February 2026
3. SAE J443_202512: Procedures for Determining and Verifying Peening Intensity, revised December 2025
4. SAE AMS2432E: Shot Peening, Computer Monitored, revised October 2022
5. SAE J2441_202511: Shot Peening, stabilized November 2025
Standards note: Use the complete revision invoked by the contract. This guide does not reproduce the J2597 algorithm, reference datasets or tolerance criteria.
Author: Paweł Kmieć
Discuss an intensity-control requirement: +48 519 772 773 | [email protected]