


How multiple Almen-strip exposures, curve evaluation and the 2T criterion establish a defensible peening-intensity result
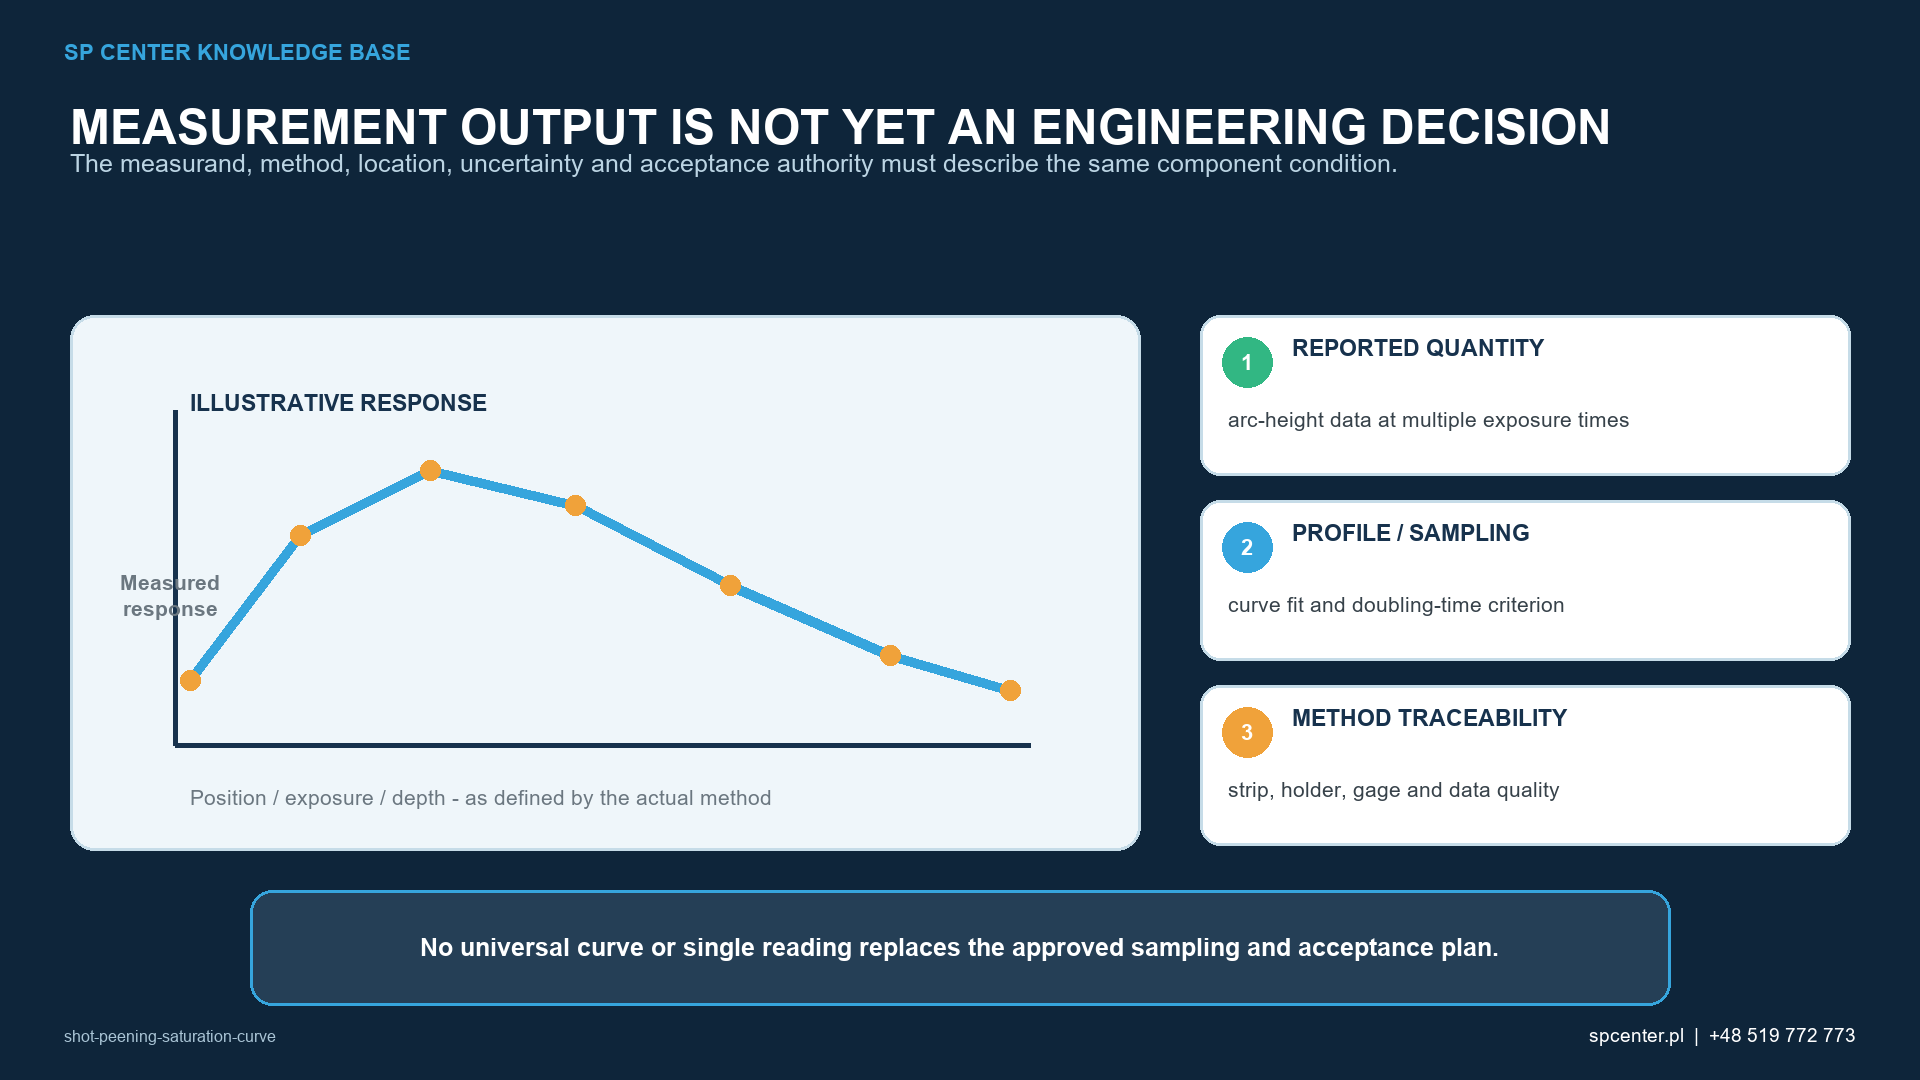
A shot peening saturation curve relates the arc height of an Almen strip to controlled exposure for one defined peening-stream configuration. The curve supports determination of Almen intensity at the saturation point required by the invoked procedure. One strip cannot establish saturation, and saturation time must not be used automatically as component coverage time or production exposure.
What does a saturation curve represent?
Individual conforming Almen strips are exposed at different controlled values while media, delivery settings, verification geometry, holder and measurement route remain unchanged. Arc height is measured after each exposure and evaluated against exposure. The curve rises and then approaches a flatter region as additional exposure produces progressively smaller arc-height increases.
| Quantity | Meaning | What it is not |
|---|---|---|
| Exposure variable | Controlled time, passes or equivalent measure applied to each strip | A universal machine time transferable between setups |
| Arc height | Measured curvature response of the specified Almen strip | Residual stress or component deformation |
| Saturation time | Exposure at which the invoked saturation criterion is met | Automatically the component peening time |
| Almen intensity | Arc height at the determined saturation time, reported with strip designation | Pressure, wheel speed, media flow or coverage |
Table 1. Saturation terminology separates measured strip response from machine inputs and component acceptance.
How is the 2T saturation criterion applied?
When the governing procedure is SAE J443, the saturation point is located on the accepted curve where doubling exposure from T to 2T produces no more than a 10% increase in evaluated arc height. The criterion is applied to the curve, not by selecting two convenient raw measurements. It is not a ±10% tolerance on the reported intensity.
| Curve check | Required question | Typical failure |
|---|---|---|
| Data range | Do the points cover the rising region and approach to saturation? | All points are too early or too late to locate saturation |
| Stable configuration | Were media, flow, pressure or wheel speed, geometry and holder controlled? | Data from materially different stream configurations are mixed |
| Curve evaluation | Was the accepted fitting or evaluation method used? | Straight segments are drawn by eye or one raw point is selected |
| 2T criterion | Does the evaluated curve satisfy the invoked criterion at T and 2T? | The 10% value is applied to time or treated as an intensity tolerance |
| Reporting | Are intensity, strip designation, exposure definition and traceability clear? | Arc height is reported without the strip designation |
Table 2. A valid result depends on controlled data, accepted evaluation and correct interpretation.
Why is one strip insufficient?
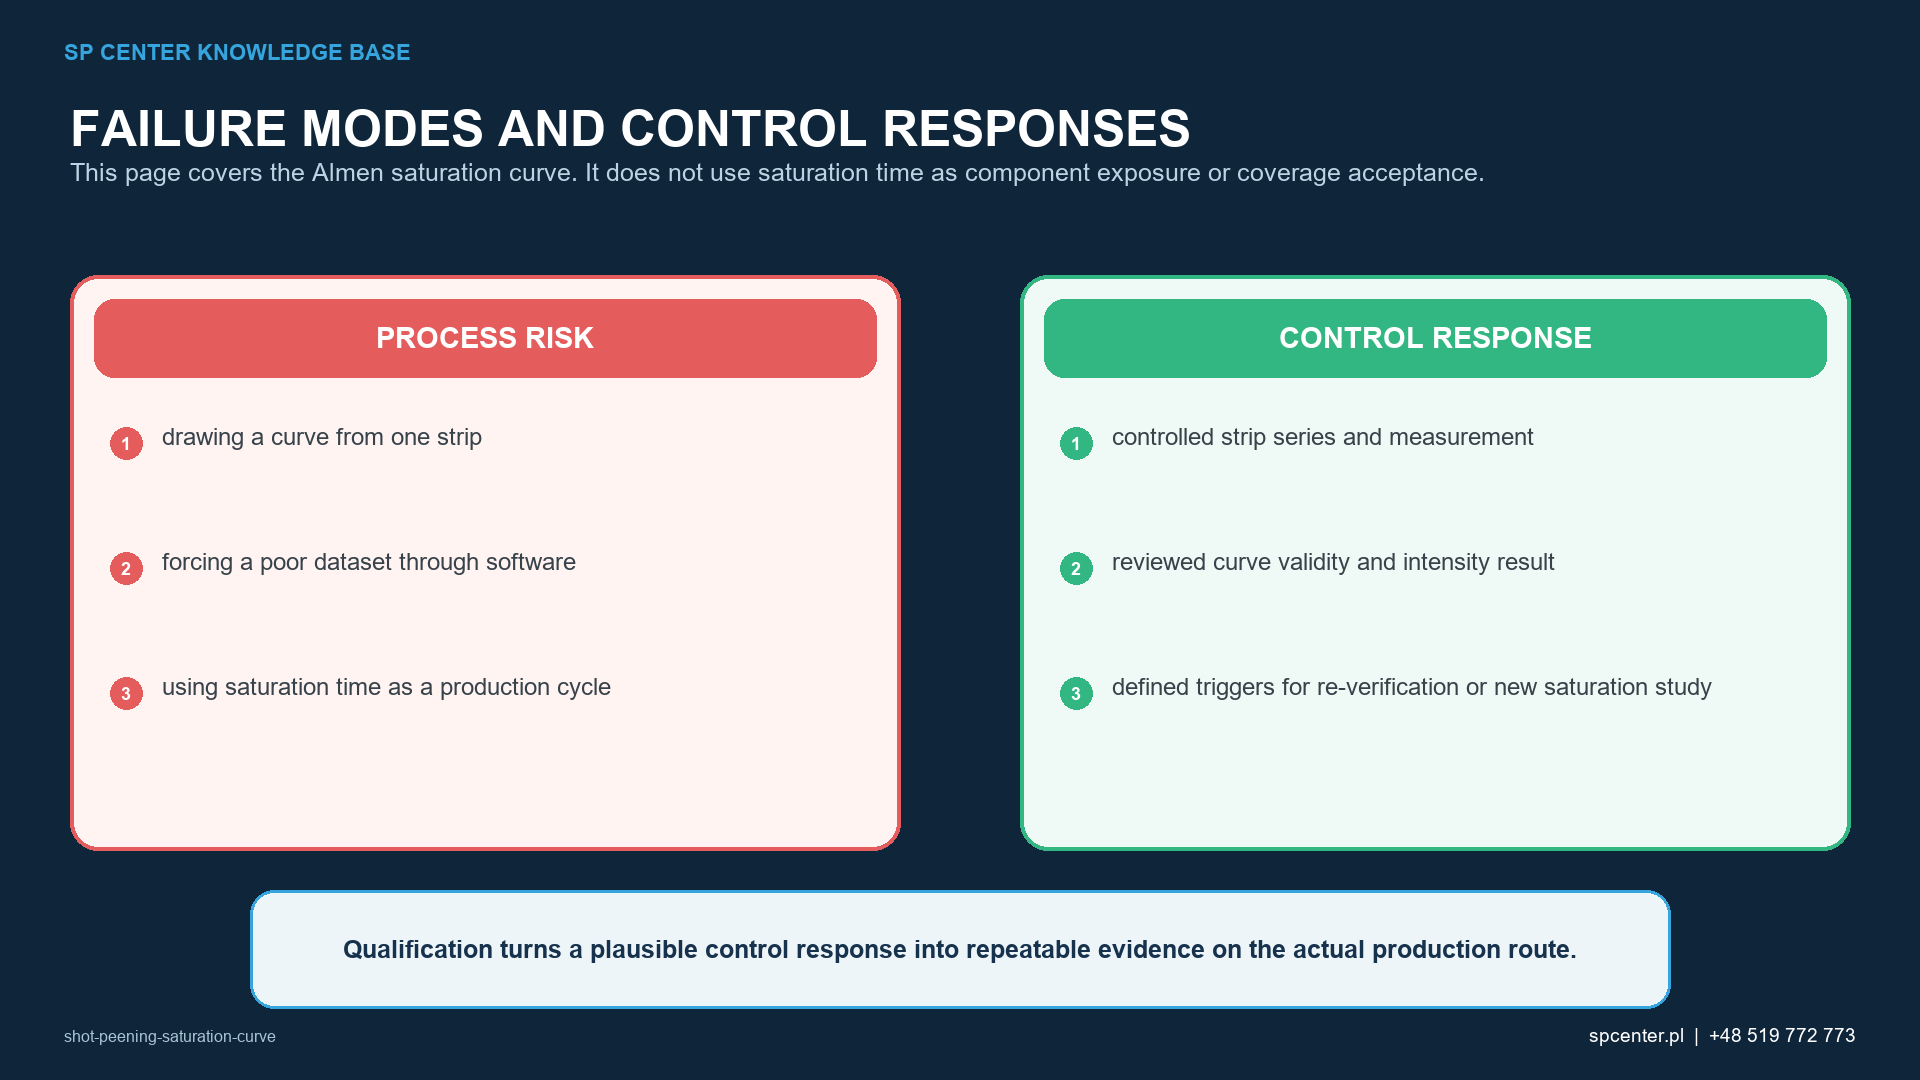
One strip gives one response at one exposure. It cannot show whether the response is still rising steeply, already near saturation or affected by an unstable stream. A production verification strip may confirm an already established intensity when the governing procedure permits it, but it does not replace a saturation study when a new curve is required.
How many strips are required?
There is no responsible universal number independent of the invoked method and data quality. The dataset must satisfy the current procedure, support the accepted evaluation and span enough of the rising and flattening regions to locate saturation. Additional points may be needed when the initial range is poorly placed, scatter is excessive or the curve fit is not credible.
Why is saturation time not component exposure?
| Evidence layer | Question answered | What remains separate |
|---|---|---|
| Saturation curve | What standardized intensity does this stream configuration produce? | Coverage and component response |
| Coverage development | What exposure produces the specified coverage on the component under the approved method? | Almen saturation time |
| Authorized production exposure | Which approved cycle, including any required multiplier, must production reproduce? | Universal transfer to another setup |
| Component surface acceptance | Are boundaries, coverage, surface condition and invoked dimensions acceptable? | Residual-stress or fatigue validation |
| Component validation | Does the route create the required application-specific engineering response? | Routine stream verification unless separately required |
Table 3. Almen-strip saturation, component processing and engineering validation are related but separate evidence layers.
Fillets, gear roots, bores and masked boundaries can have different access, impact angle and particle flux from a flat Almen strip. A valid curve therefore does not prove complete component coverage, acceptable surface condition or an intended residual-stress profile.
How is a defensible saturation study performed?
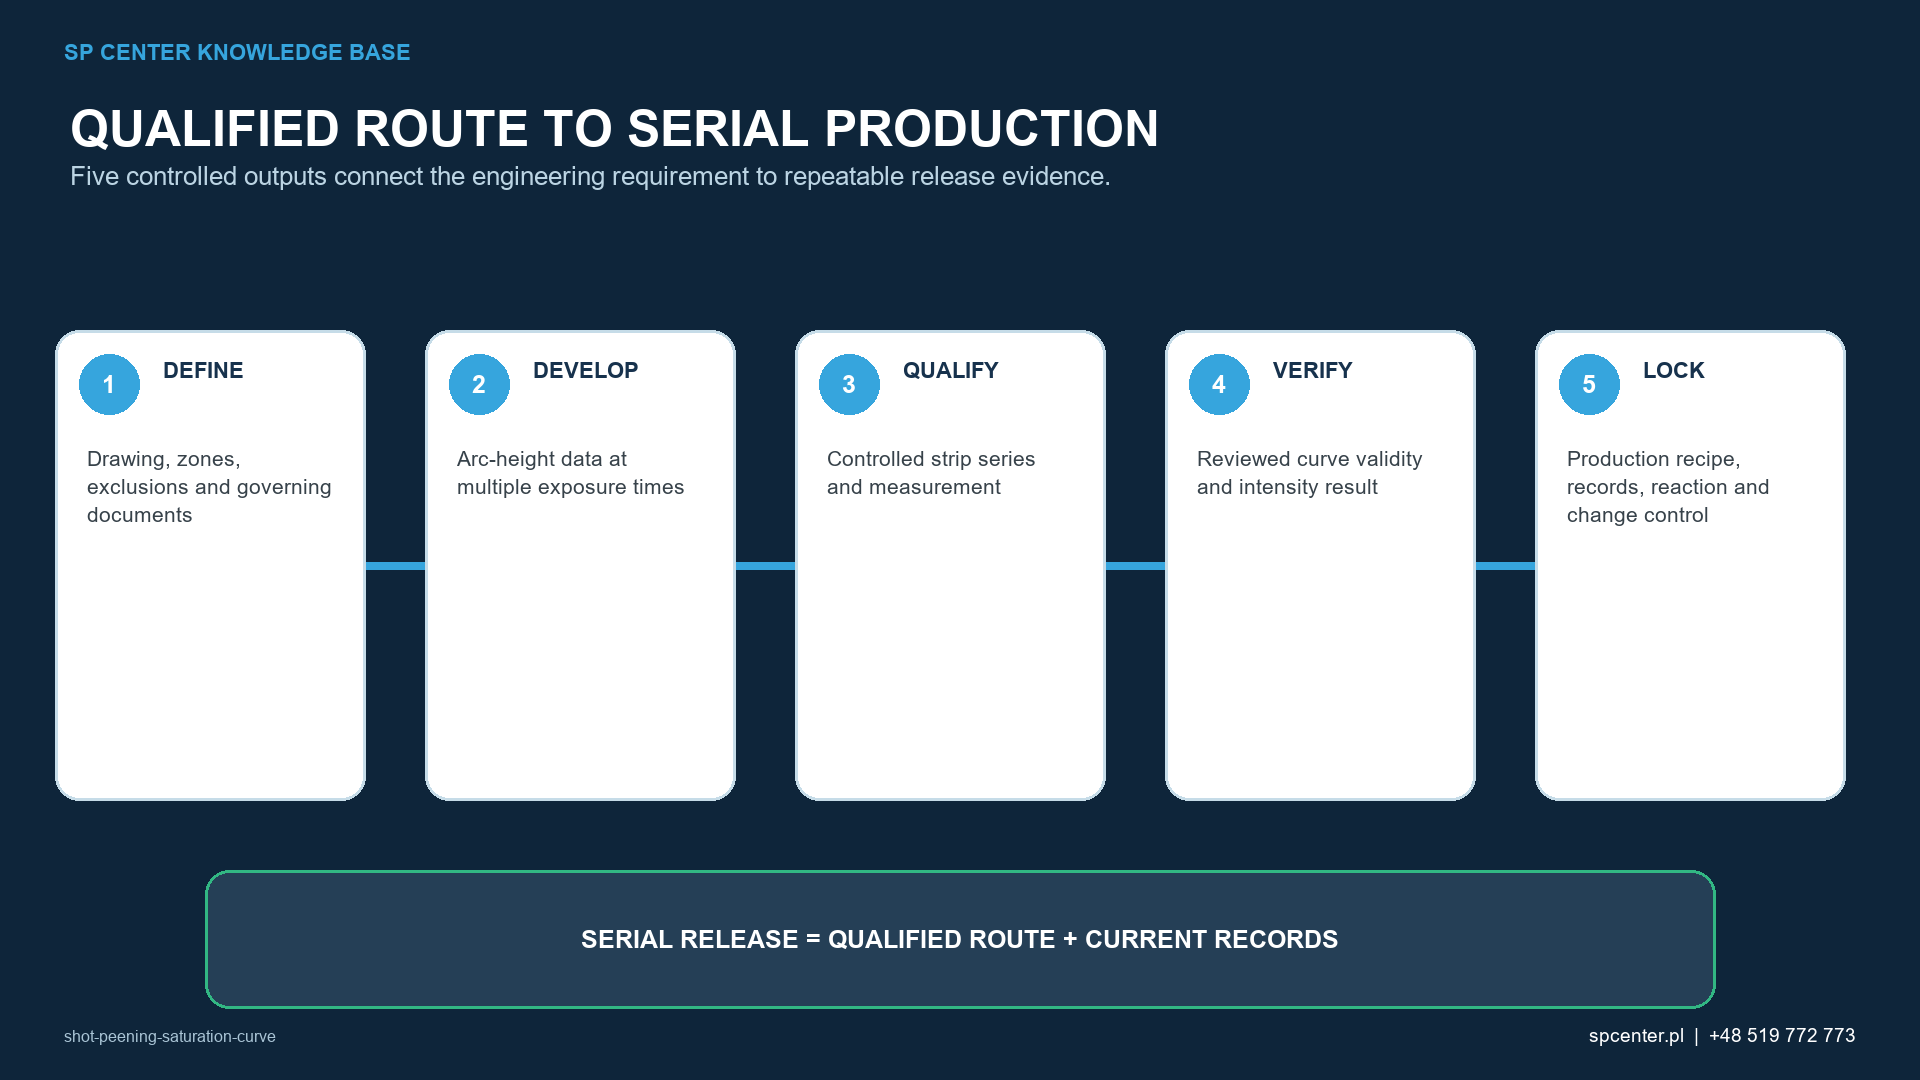
| Study stage | Required output |
|---|---|
| Define configuration | Machine, media, delivery settings, nozzle or wheel, holder location and orientation |
| Plan exposure points | Range expected to capture the rise and approach to saturation |
| Expose strips | One controlled exposure for each identified conforming strip |
| Measure arc height | Applicable gage, zeroing, strip orientation and recorded readings |
| Evaluate curve | Approved method, saturation criterion, residual review and retained raw data |
| Report intensity | Arc height at saturation with strip designation and required traceability |
| Link to component route | Coverage exposure, production cycle, surface acceptance and control plan |
Table 4. The curve is one element of the broader qualified production route.
How should questionable data be handled?
- Use traceable strip type, lot and status with conforming holder and gage equipment.
- Keep stream and verification geometry unchanged throughout the study.
- Investigate non-monotonic or implausible points instead of silently deleting them.
- Retain raw readings, exposure definition, curve result and configuration identity.
- Confirm that software method and version are controlled when computer evaluation is used.
When must the curve be re-established?
| Potential change | Why review is required |
|---|---|
| Media family, size, hardness or operating mix | Particle response and the standardized stream can change |
| Nozzle, wheel, holder or delivery position | Acceleration and geometry at the verification location can change |
| Pressure, wheel speed or media-flow range | Stream energy and population can move outside the qualified configuration |
| Fixture, motion or machine | Component delivery and the relationship to the verified stream can change |
| Maintenance affecting the stream path | Restored nominal settings do not by themselves prove the prior stream response |
Table 5. The governing specification and approved change-control plan determine whether review, re-verification or a new saturation study is required.
Frequently asked questions
What is a shot peening saturation curve?
It is the evaluated relationship between controlled exposure and Almen-strip arc height for one defined peening-stream configuration. It is used to determine or support verification of Almen intensity under the invoked procedure.
Can one Almen strip establish a saturation curve?
No. One strip provides one arc-height value at one exposure and cannot establish curve shape or the saturation relationship. Use the valid data required by the invoked procedure.
What does the 2T criterion mean?
Under the SAE J443 procedure, saturation is located where doubling the exposure from T to 2T increases the evaluated arc height by no more than 10%. This is a curve criterion, not an intensity tolerance.
Is saturation time the production peening time?
Not automatically. Saturation time belongs to the standardized Almen-strip study. Component coverage exposure and the authorized production cycle are established separately.
Does a valid curve prove component coverage?
No. A flat Almen strip and a complex component have different access, angle and particle flux. Component coverage requires its own approved evaluation.
When is a new saturation study required?
The governing specification and change-control plan decide. Review changes to media, flow, pressure or wheel speed, nozzle or wheel, holder, delivery position, equipment and any maintenance that can affect the stream.
Key takeaways
- Develop saturation from multiple controlled strip exposures.
- Apply the invoked curve method and 2T criterion to evaluated data.
- Report Almen intensity with the applicable strip designation.
- Keep saturation time, component coverage exposure and production exposure separate.
- Treat the curve as standardized stream evidence, not a component residual-stress map.
Related SP Center guides
Technical references
1. SAE J443_202512: Procedures for Determining and Verifying Peening Intensity, revised December 2025
2. SAE J442_202602: Tools for Peening Intensity Determination and Verification, revised February 2026
3. SAE J2597_201709: Computer Generated Shot Peening Saturation Curves
4. SAE J2277_202301: Shot Peening Coverage Determination, revised January 2023
Standards note: Use the complete procedures and revisions invoked by the drawing, contract and customer requirements.
Author: Paweł Kmieć
Discuss your shot peening requirement: +48 519 772 773 | [email protected]